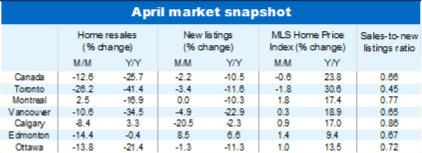
The Bank of Canada’s interest rate liftoff was quick to rein in supercharged housing activity and weigh on home prices. Back-to-back overnight rate hikes in March and April—including an outsized 50 basis-point increase last month—set the stage for a sizable 12.6% drop in home resales across Canada between March and April. More importantly, benchmark prices fell month-over-month (-0.6%) for the first time in two years. This is a remarkable turn of events. Property values soared at the fastest pace on records through the fall and winter, as super-strong demand and scarce supply fueled bidding wars from coast to coast. We expect our central bank’s `forceful’ monetary policy normalization will further cool demand in the period ahead.
Severe imbalances rapidly easing
Demand-supply conditions remain tight overall but the trend is improving. In some markets (including Toronto, Hamilton, Niagara region, Kitchener-Waterloo and Windsor), the sales-to-new listings ratio even reached balanced-market territory in April. The rebalancing process is taking place predominantly on the demand side with buyers facing more challenging affordability conditions. The number of sellers entering the market is still shrinking. New listings fell 2.2% m/m in Canada and a majority of markets last month including Vancouver, Calgary, Saskatoon, Winnipeg, Hamilton, Toronto and Ottawa.
Benchmark prices decline in Ontario and BC markets
Extremely bullish market sentiment is souring in parts of the country that saw tremendous price gains over the past year. This was the case in many southern Ontario markets. The MLS Home Price Index fell in April in London (-4.0% m/m), Cambridge (-3.9%), Brantford (-2.6%), Niagara region (-1.9%), Toronto (-1.8%), Kingston (-1.8%), Barrie (-1.5%), Kitchener-Waterloo (-1.1%) and Hamilton (-1.1%). It was a similar story in a few BC markets, including Chilliwack (-1.7% m/m) and the Fraser Valley (-0.1%). The Vancouver index increased at its slowest pace (0.3% m/m) in almost two years.
Property values still rising solidly in Atlantic Canada and the Prairies
Despite some moderation in April, activity continues to be hectic in Atlantic Canada and the Prairie provinces. With supply still low, this maintains intense upward pressure on prices in these regions. The MLS HPI continued to soar in April in Halifax-Dartmouth (up 5.6% m/m), Saint John (up 3.2%), Fredericton (up 2.7%) and Moncton (up 2.4%), while it increased moderately in Edmonton (up 1.4%), Regina (up 1.2%), Calgary (up 0.8%), Saskatoon (up 0.6%) and Winnipeg (up 0.4%). Major Quebec markets also posted modest price advances.
The more affordable markets less sensitive to rising interest rates
The resilience in Atlantic Canada and the Prairies can be largely explained by their relative affordability. Lower priced markets are less sensitive to rising rates. This advantage will continue to support demand and prices in those regions though it won’t entirely offset the impact of the Bank of Canada raising its policy rate to 2.5% by the fall as we expect. Buyers in Canada’s most expensive markets (mainly located in Ontario and British Columbia) will be the most affected by higher borrowing costs.
The market has likely peaked this cycle
We think the sizable drop in activity in April marks a turning point for the Canadian market with further cooling on the way. The Bank of Canada’s setting out to aggressively normalizing its monetary policy is a game-changer for the market—turning what has been a tremendous tailwind into a stiff headwind for the market.
A welcome correction, not a meltdown
After a nearly two year-long frenzy that propelled property values to the stratosphere in many parts of the country, a calmer outlook for the market should be welcome news. We expect the burgeoning price correction seen in Ontario and parts of British Columbia to deepen and spread to other markets as market sentiment sours but it’s unlikely to morph into a meltdown. Positive demographic factors will provide a safety net against a hard landing. Please see our most recent market outlook report for a more detailed discussion.


See PDF with complete charts
This article is intended as general information only and is not to be relied upon as constituting legal, financial or other professional advice. The reader is solely liable for any use of the information contained in this document and Royal Bank of Canada (“RBC”) nor any of its affiliates nor any of their respective directors, officers, employees or agents shall be held responsible for any direct or indirect damages arising from the use of this document by the reader. A professional advisor should be consulted regarding your specific situation. Information presented is believed to be factual and up-to-date but we do not guarantee its accuracy and it should not be regarded as a complete analysis of the subjects discussed. All expressions of opinion reflect the judgment of the authors as of the date of publication and are subject to change. No endorsement of any third parties or their advice, opinions, information, products or services is expressly given or implied by Royal Bank of Canada or any of its affiliates. This document may contain forward-looking statements within the meaning of certain securities laws, which are subject to RBC’s caution regarding forward- looking statements. ESG (including climate) metrics, data and other information contained on this website are or may be based on assumptions, estimates and judgements. For cautionary statements relating to the information on this website, refer to the “Caution regarding forward-looking statements” and the “Important notice regarding this document” sections in our latest climate report or sustainability report, available at: https://www.rbc.com/community-social- impact/reporting-performance/index.html. Except as required by law, none of RBC nor any of its affiliates undertake to update any information in this document.


