US industrial output has softened this year, and the escalating trade war with China is partly to blame. Threatened additional US tariffs on Chinese products and on auto imports from Europe and Japan risk pushing the sector into full-blown slowdown mode. What’s happening in the industrial sector challenges the notion that the US has less to lose in a trade war with China, but that is also why we continue to assume that tensions will ultimately ease.
The US May Have as Much or More to Lose as China
China exports more to the US than the US exports to China—about three-times more last year (~$560 billion vs. ~$180 billion). So Chinese exporters, the thinking sometimes goes, have more to lose from the current trade dispute. But import tariffs are paid by domestic producers and consumers, not foreign exporters. So another way to look at the large trade deficit is that it allows the US to impose a larger tax on American producers and consumers. And, for the most part,US importers have not been able to find alternative sources to avoid tariffs and/or extract offsetting price concessions from foreign-country exporters.
Average Tariff Hikes Getting Bigger – and Concentrated in the Industrial Sector
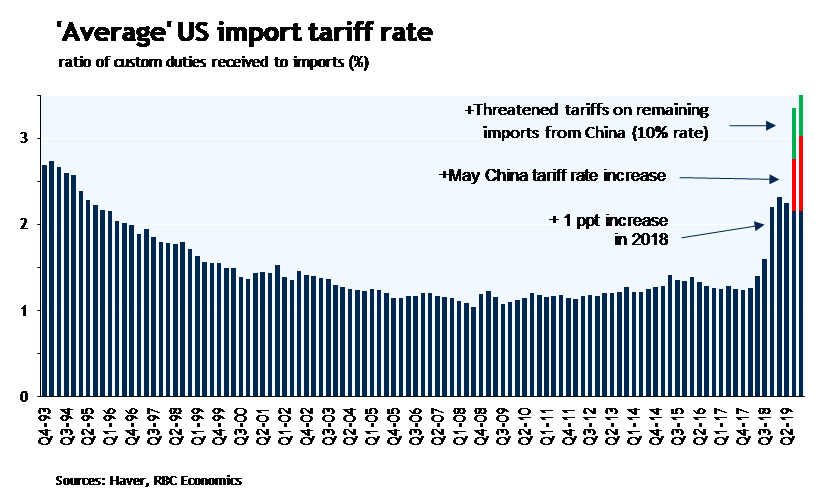
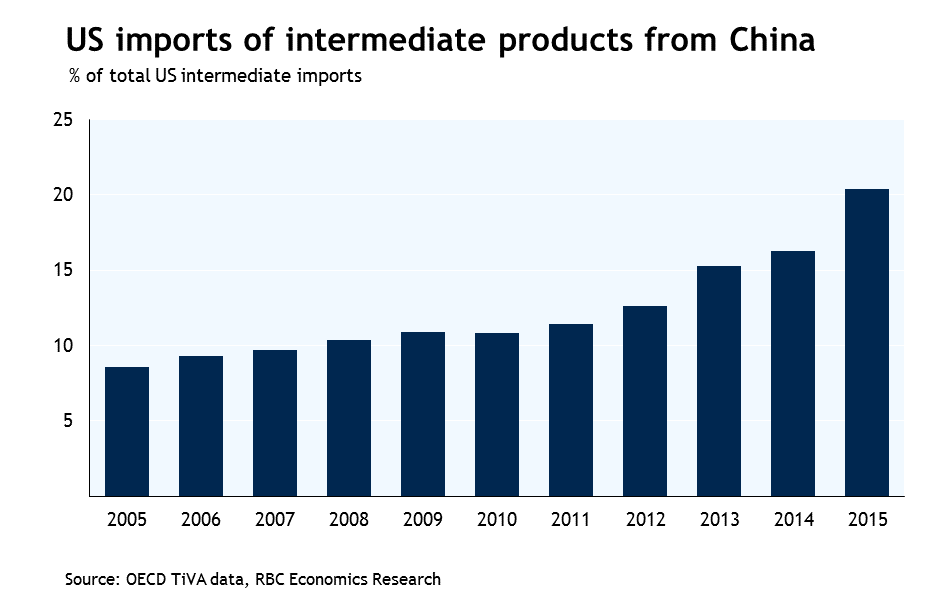
US tariff hikes last year weren’t actually that big when measured against total imports. Measures last year pushed the ‘average’ tariff rate up by about 1 percentage point. But further tariff hikes on imports from China announced in May,with the threat of more to come if negotiations around the G-20 meetings at the end of the month don’t go well, could more than double that.And the vast majority of those tariffs have targeted imports to the US industrial sector. In part, that’s by design. The Trump administration has tried to avoid targeting products that would obviously and quickly increase prices for consumers. But China has also become an increasingly important source of imported production inputs. It accounted for ~20% of total US imports of intermediate goods as of the latest estimates from the OECD. 10 years earlier, that share was just 8½%. The remaining tranche of tariffs the US is threatening on China—covering the vast majority of total US imports—is more varied by product type but still includes a big industrial component.
Tariffs Have Not Brought Production Back to the US
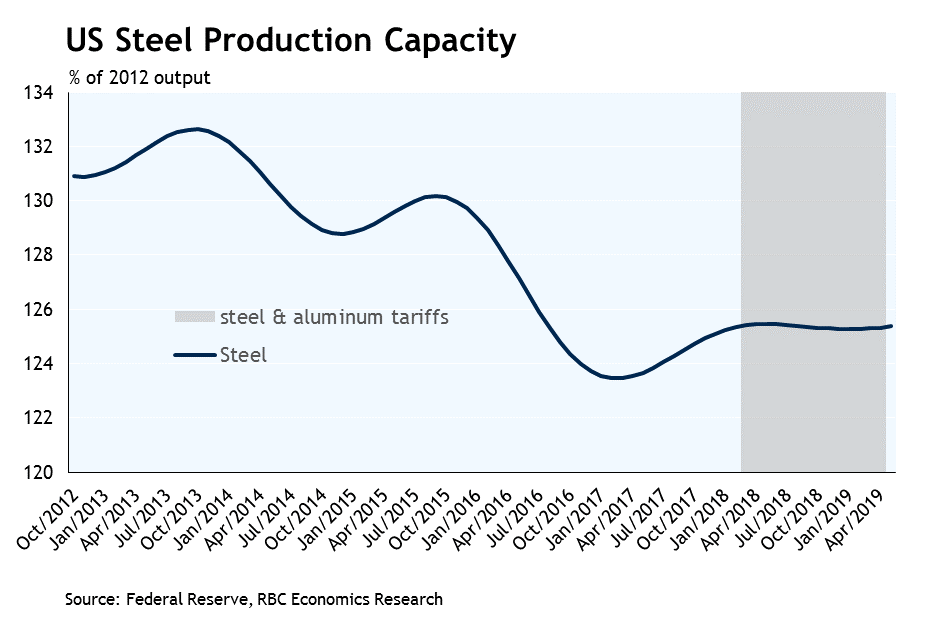
If the US trade actions were meant to boost manufacturing stateside, they haven’t succeeded. US industrial output and capacity utilization rates have fallen since 10%tariffs were imposed on $200 billion of imports from China in late September last year. Manufacturing output has managed just one monthly increase out of five to date in 2019, and sentiment has deteriorated. The latest ISM manufacturing report was riddled with business references to a negative impact from rising tariff costs.The (now-repealed) steel and aluminum tariffs that were in place most of the last year raised costs for broad swaths of the manufacturing sector that use those products as production inputs. And they did little to juice US steel and aluminum production and investment. US steel production averaged about 4% above the 6-month pre-tariff average over the period US tariffs were in place. Total steel production capacity didn’t increase at all. That’s not surprising: increasing production capacity requires capital investment, but companies are unlikely to undertake expensive long-run investments in response to trade disruptions that are likely to be temporary.
US Businesses Have Struggled to Find Alternative Imports
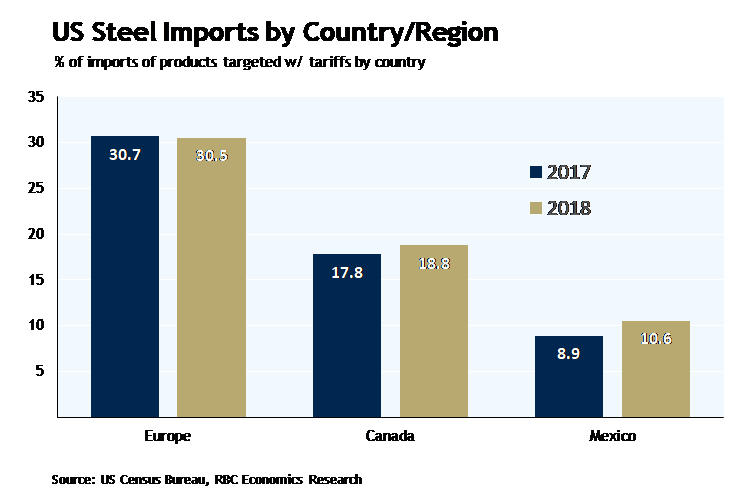
The US hasn’t been particularly strategic in applying tariffs. In many cases,that has made it difficult for US industrial purchasers to find alternative sources quickly. US imports of steel products targeted with 25% tariffs last year still increased ~1½% in 2018. And the share coming from Europe,Canada, and Mexico—areas most targeted by the trade action—actually increased. Imports of products from China targeted by US tariffs last September fell by 22% from a year ago year-to-date through April. But US producers were not able to find alternative import sources. Imports of those same products from all countries declined a similar amount.And the decline in US import values does not appear to reflect lower prices charged by Chinese exporters. US import prices from China are down only ~1%from a year ago to-date through April, and that is despite a 6% appreciation in the USD relative to Chinese RMB that one might have thought would make imports look cheaper to US buyers even without tariffs. That has broadly been a theme across US tariff actions to-date. Foreign exporters have by-and-large not been willing or able to make price concessions to offset increased US import tariff costs. That has left US importers with the unhappy decision to either import less or pay more.
Odds Are Still That the US Blinks First
As it stands, the US industrial sector looks ill-prepared to handle further tariff hikes on Chinese products and the threat of tariffs on auto imports from Europe and Japan still looms. That still wouldn’t necessarily mean an economy-wide recession. The 85% of the US economy that is not the industrial sector has shown little evidence of slowing. Labour markets still look solid and the Fed has made it clear that it will step in with rate cuts if broader growth trends soften. But escalating trade tensions have begun to threaten real job losses, and particularly in the politically important industrial heartland that was critical to President Trump’s 2016 election victory.That also is one of the main reasons we still assume tensions will ultimately ease. President Trump faces re-election next year.President Xi Jinping does not.
Canada Is Caught in the Middle
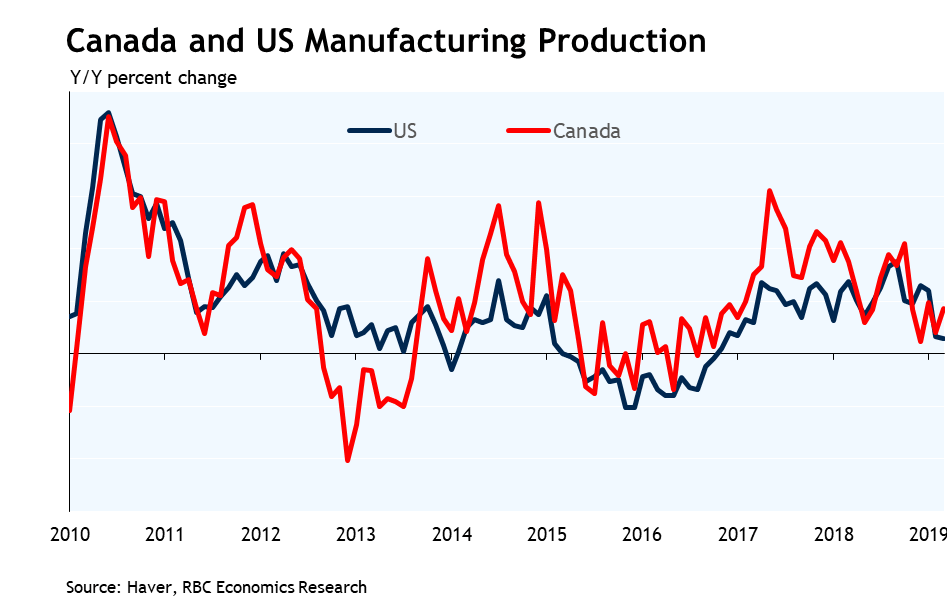
Canada is already paying an economic price for escalating US-China trade and geopolitical tensions. It’s difficult to believe that the effective Chinese ban on imports of Canadian canola isn’t related to the bigger powers’ dispute. But Canada’s direct exposure to a bilateral trade disruption with China is limited because China still only accounts for ~5% of Canadian exports. The larger Canadian vulnerability to the trade dispute is via spill-overs from any slowdown in the US industrial sector. The US still accounts for ~70% of Canada’s exports, and cross-border production chains are incredibly closely integrated. Indeed, more than a quarter of the value of Canada’s manufacturing exports actually reflect the cost of intermediate production inputs imported from the US. Anything that raises costs and restrains activity in the US industrial sector will have negative spill-overs to Canada. Slower global growth would also weigh on commodity prices. And uncertainty about the trade outlook will continue to weigh on Canadian business investment, even if Canada, for now, seems to be out of the US cross-hairs. If the unexpected escalation and then easing of tensions with Mexico in recent weeks did anything, it was to reinforce the message that no trade agreement is really protection from an escalation of trade tensions with the Trump administration. That only adds to uncertainty about the future of international trade, and will continue to weigh on business investment spending in Canada and abroad.
This article is intended as general information only and is not to be relied upon as constituting legal, financial or other professional advice. The reader is solely liable for any use of the information contained in this document and Royal Bank of Canada (“RBC”) nor any of its affiliates nor any of their respective directors, officers, employees or agents shall be held responsible for any direct or indirect damages arising from the use of this document by the reader. A professional advisor should be consulted regarding your specific situation. Information presented is believed to be factual and up-to-date but we do not guarantee its accuracy and it should not be regarded as a complete analysis of the subjects discussed. All expressions of opinion reflect the judgment of the authors as of the date of publication and are subject to change. No endorsement of any third parties or their advice, opinions, information, products or services is expressly given or implied by Royal Bank of Canada or any of its affiliates. This document may contain forward-looking statements within the meaning of certain securities laws, which are subject to RBC’s caution regarding forward- looking statements. ESG (including climate) metrics, data and other information contained on this website are or may be based on assumptions, estimates and judgements. For cautionary statements relating to the information on this website, refer to the “Caution regarding forward-looking statements” and the “Important notice regarding this document” sections in our latest climate report or sustainability report, available at: https://www.rbc.com/community-social- impact/reporting-performance/index.html. Except as required by law, none of RBC nor any of its affiliates undertake to update any information in this document.


