Natural gas currently presents one of Canada’s biggest climate choices
Expansion of the abundant resource could unlock a fresh wave of economic activity and help cut global emissions. But we risk missing our Net Zero targets without major investments in abatement technologies.
As major energy importers Japan and Germany eye Canadian natural gas, federal and provincial policymakers are wrestling with a conundrum: Turn them away and risk more global energy volatility or tap British Columbia and Alberta gas and leave Canada’s economy more exposed to shifts in the global gas outlook.
The Japan-led G7 Summit in May will struggle with this twin challenge of managing energy and climate security. The group of the world’s richest countries are still debating natural gas’s role in ensuring market stability. A strategic energy alliance that protects the group’s long-term economic prosperity and climate ambitions would bring some clarity to the path forward.
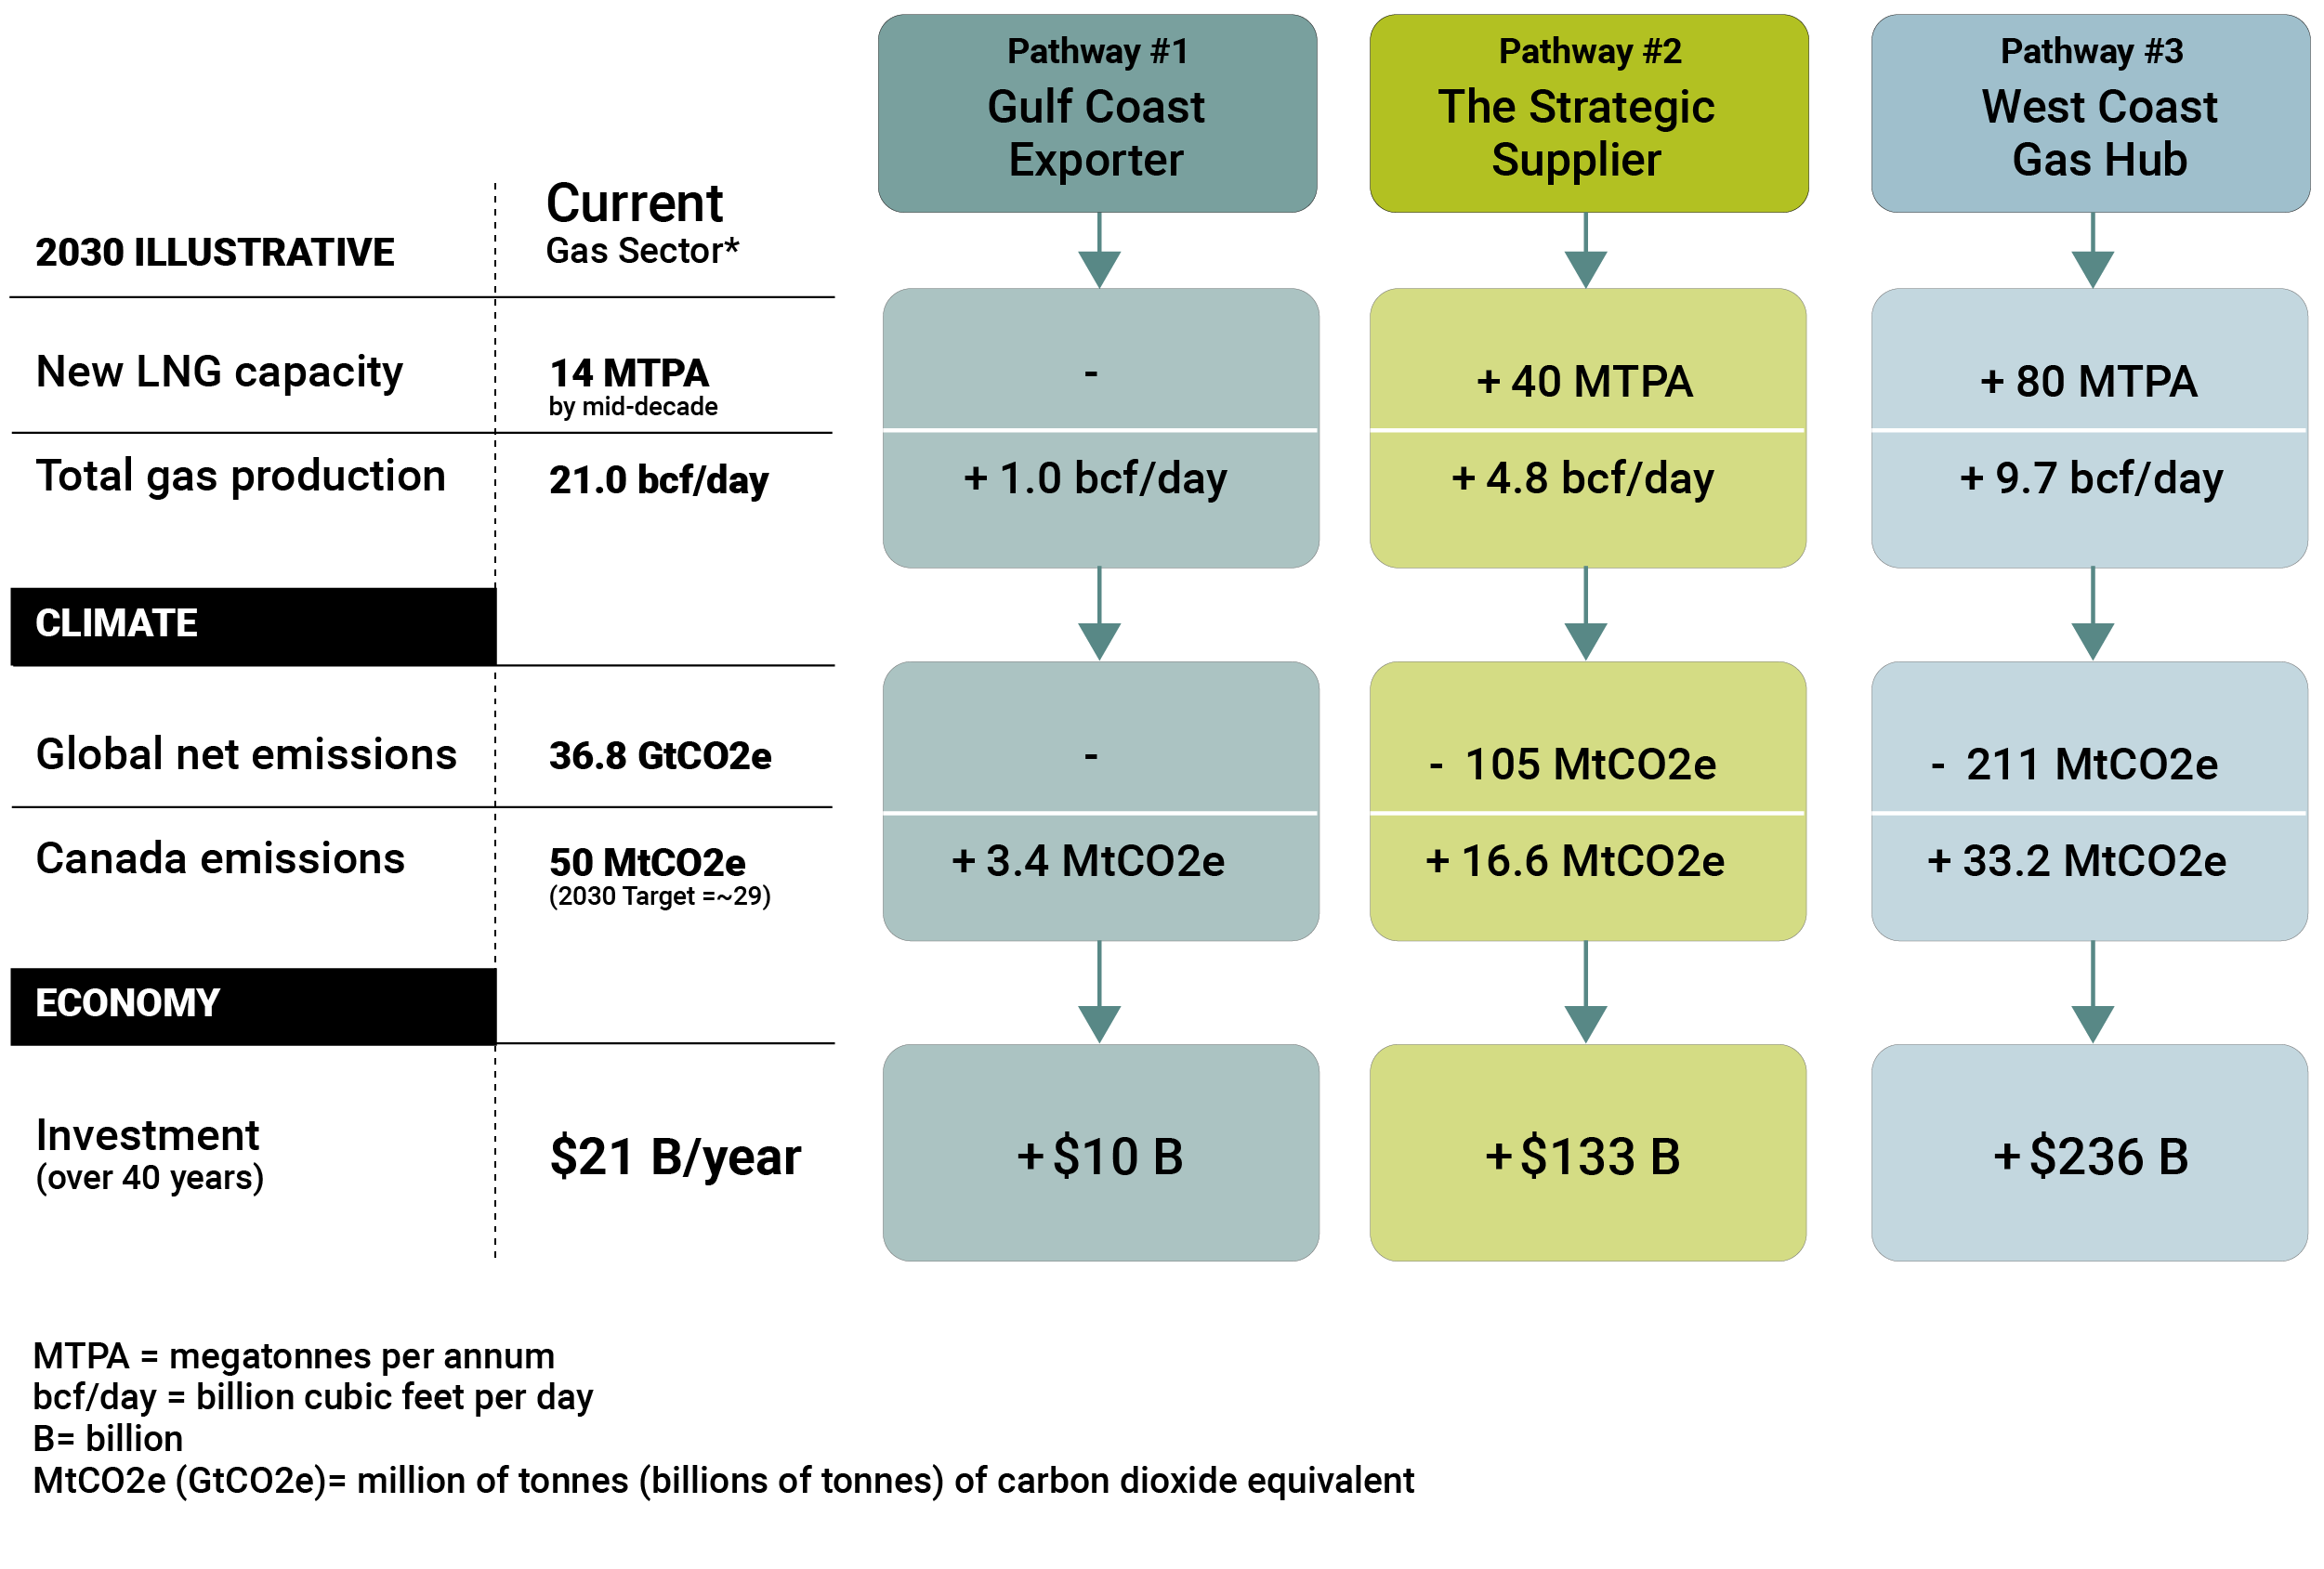
Here are three roles Canada can play:

- The Gulf Coast Gas Exporter: Ramp up natural gas exports to the U.S. Gulf Coast liquefied natural gas producers, which is developing a number of gas-exporting projects. The strategy may raise Canada’s upstream gas sector emissions by up to 7%.

- The Strategic Exporter: Carve a niche in global LNG markets as a strategic supplier of stable, low-emissions gas. A handful of projects could potentially reduce global emissions by a net 105 MtCO2e—roughly equivalent to Qatar’s total GHG emissions, but would also raise Canadian gas sector emissions by a third assuming current technologies. However, most of the upstream gas emissions and nearly a third of LNG terminal emissions could be abated with electrification and other technologies. The strategy would attract a projected $133 billion in capital investment into the Canadian economy over 40 years.

- The West Coast Hub: Build out LNG capacity to its full potential, taking a more assertive role in global natural gas markets. The strategy could reduce net global emissions by as much as 211 MtCO2e but raise the Canadian sector’s emissions by 66%. The strategy would attract more than $200 billion in investments.
Each path carries economic and climate risks that Canadian policymakers and industry must weigh. And fast. Global LNG markets are restructuring, opening fresh opportunities for West Coast projects. But that window won’t be open for long.
Canada’s Choices for Supporting Global Energy Security
Asia Key To Long-Term Demand As LNG Investors Eye New Investments
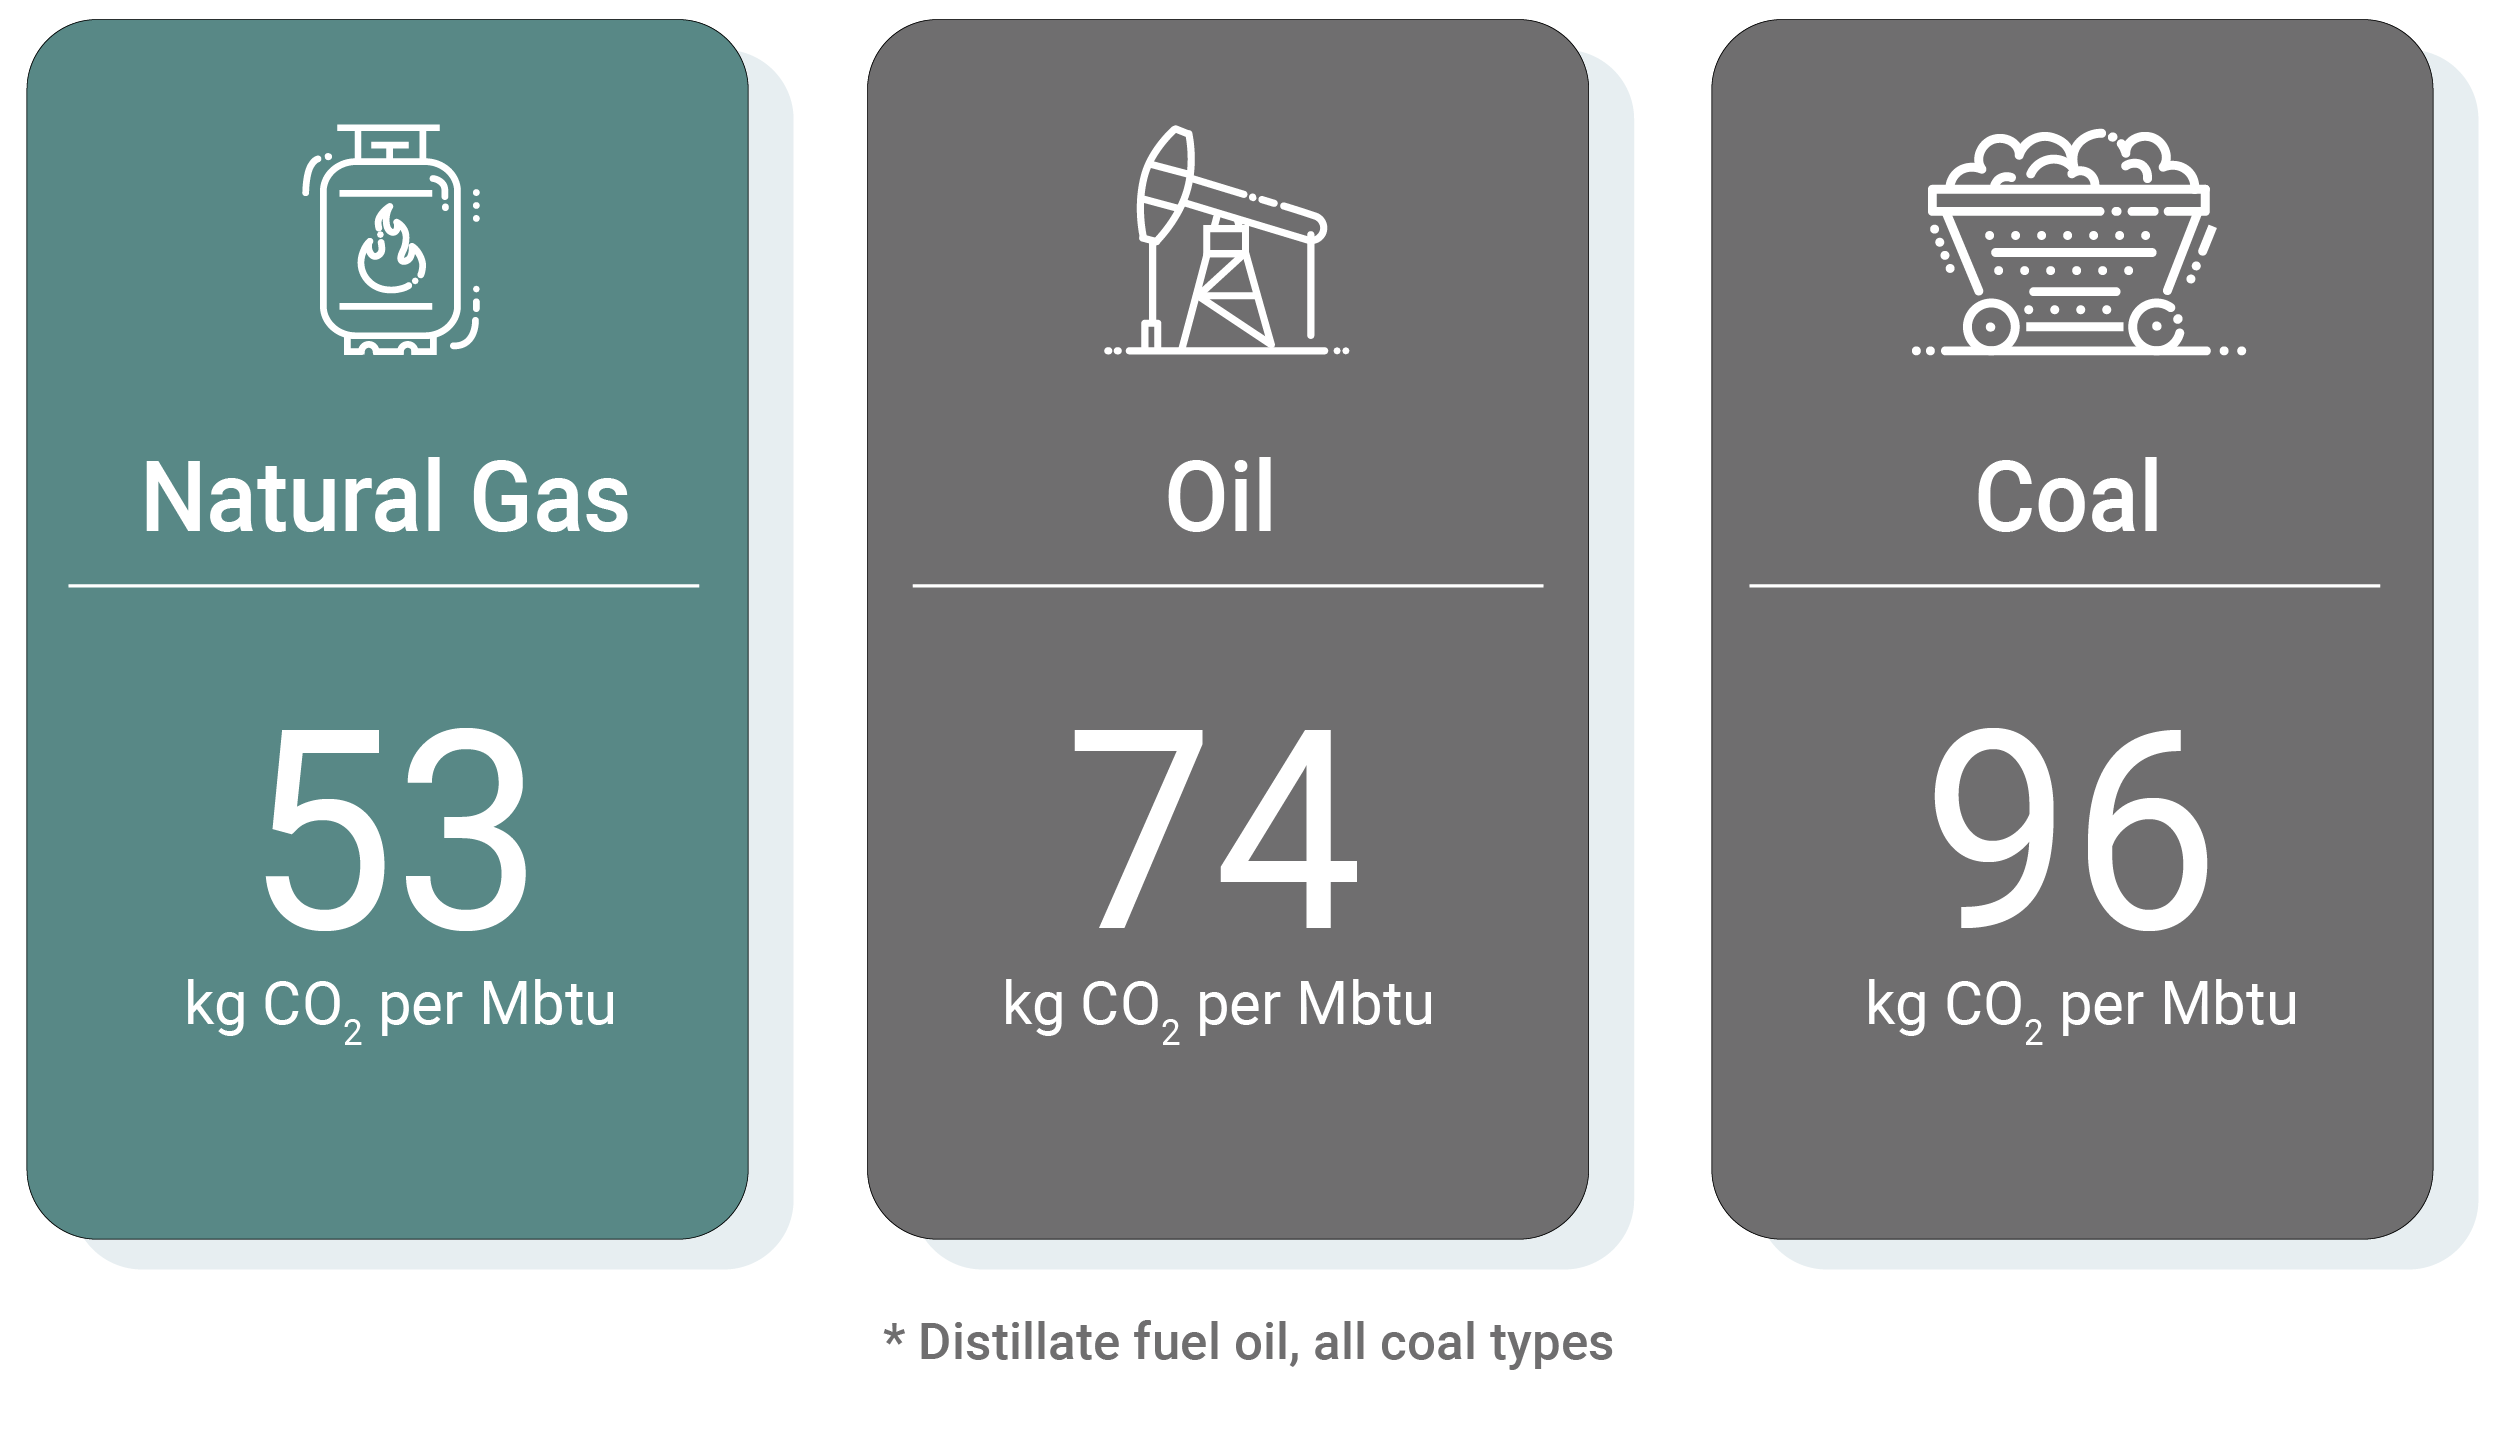
Getting to Net Zero requires the world to cut fossil fuel consumption, including natural gas. But we’re not there yet. Even as wind and solar farms spring up around the world, LNG—natural gas cooled to -162°C to 1/600th of its original volume to ship over long distances cheaply—is gaining fresh momentum. A key reason: cleaner-burning natural gas often means lower emissions than oil or coal.
Europe has demonstrated LNG’s value with its frantic dash to replace piped Russian gas, importing the equivalent of 10% of LNG trade in 2021, mostly from the U.S.
Though the EU remains intent on transitioning to a clean energy economy, for now it’s rushing to build new regasification terminals. Meanwhile, natural gas is part of the EU taxonomy for sustainable activities—albeit under strict conditions including no unabated natural gas in power generation beyond 2035. If carbon capture technology for gas abatement evolves constructively, gas could be a player in European energy for longer.
While gas will remain in the mix in Europe and other advanced economies for some time, it’s clear that future demand will decline as these economies build cleaner energy infrastructure.
Natural Gas is a cleaner-burning fossil fuel
Asia, on the other hand, will have a harder time turning away from natural gas. As one of the world’s biggest LNG importers, Japan is alarmed by its dependence on Russian and Middle Eastern countries as well as new export limits proposed by major LNG supplier Australia. It’s encouraging the development of nuclear energy, hydrogen and natural gas as part of this year’s G7 agenda.
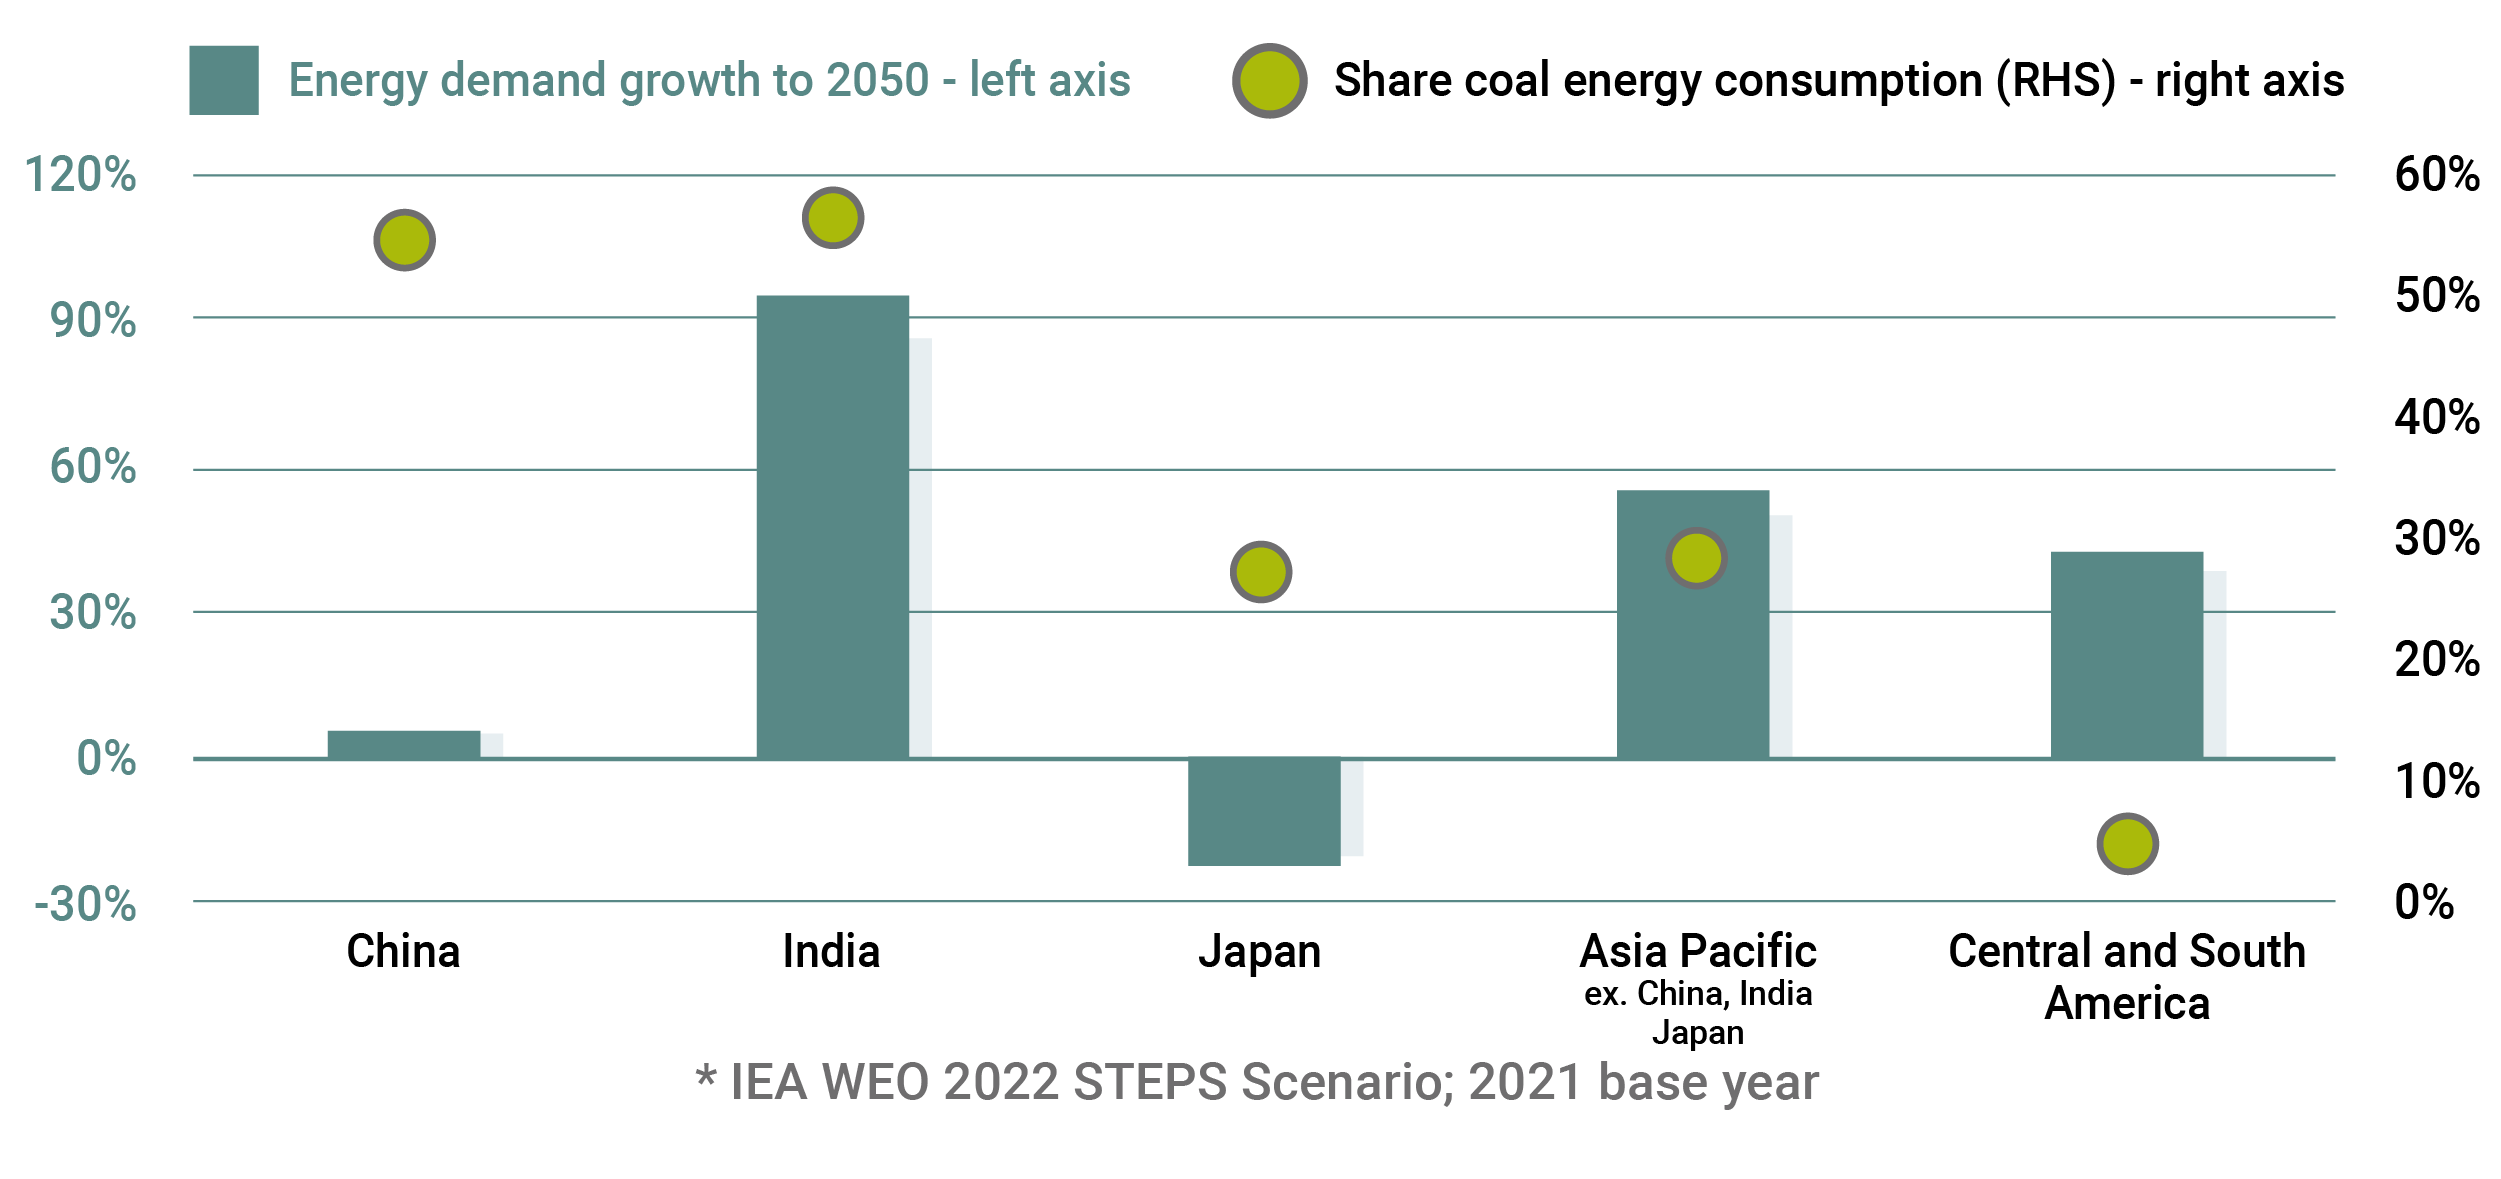
LNG will also remain an essential fuel in China, India and other populous countries of South Asia and Southeast Asia as these countries seek to meet growing energy demand while reducing a strong reliance on coal to meet climate commitments. China, India and Southeast Asia will see gas demand grow by around 44% by 2050 in the International Energy Agency’s base case scenario. LNG would take the bulk of the growth with declining local pipeline-based production.
But it’s hardly a full-blown bull case for gas. Stunned by last year’s five-fold jump in LNG prices, many Asian countries raised their coal consumption, while others pivoted to renewables, especially as the economics of switching directly from coal to clean energy in Asia improved dramatically. Non-emitting energy rollout may take a while to gain traction in Asia, but it’s still a cloud hanging over the long-term gas outlook.
Emerging markets driving gas demand
Globally, more than 100 megatonnes per annum (MTPA) of new LNG supply could be approved before 2024, adding 17% to the global LNG market. Another 1,035 MTPA are in pre-final investment decision stage, but the International Gas Union believes “a fair portion” are unlikely to proceed given investor focus on capital discipline and a reluctance to invest in long-term projects in an uncertain global energy market. There are also question marks hovering over Russia’s new planned LNG capacity, given the spate of Western sanctions and departure of oil and gas majors from the country.
With a strong market outlook in the medium term but possibly much weaker in the long-term, would 25 to 40-year Canadian LNG liquefaction capacity investments be profitable?
Canada’s Proposition
LNG Canada Phase I, a large B.C. export facility backed by Royal Dutch Shell, Malaysia’s Petronas BHD, PetroChina Co., Japan’s Mitsubishi Corp. and Korea Gas Corp. will mark Canada’s first meaningful entry in global LNG markets by mid-decade. The project’s capacity of 14 MTPA will place Canada among the top 10 largest LNG exporters in one fell swoop. Woodfibre LNG and Cedar LNG, with a combined capacity of up to 6 MTPA, are advancing toward development.
Global majors are certainly taking another look at new West Coast projects, drawn by the demand for diversified gas suppliers and some compelling advantages:
- Canada is the world’s 4th largest natural gas producer, and home to a huge concentration of conventional and unconventional natural gas reserves.
- The Montney shale basin straddling Alberta and B.C.—about the size of New Brunswick and Nova Scotia combined—can potentially produce 449 trillion cubic feet of natural gas, nearly six times Canada’s conventional gas reserves. And Montney reserves are relatively cheap: a 2018 study found 200 years supply in the basin below $2.50 per million British thermal units breakeven.[1]
- B.C. projects are about 10 shipping days from Asia, compared to 20 for U.S. Gulf Coast exporters via the tolled Panama Canal, reducing both costs and emissions. The only major active U.S. West Coast LNG project is the federally-approved US$39-billion Alaska project.
- Canada’s world-leading methane regulations, naturally low formation CO2 in the Montney, and promise of clean electricity supply is prized by global producers eager to reduce their greenhouse gas emissions. Two proposed Canadian LNG projects are majority-backed by Indigenous groups, suggesting strong local support.
Distance To Asia
Nautical miles
Source: Oxford Energy Institute
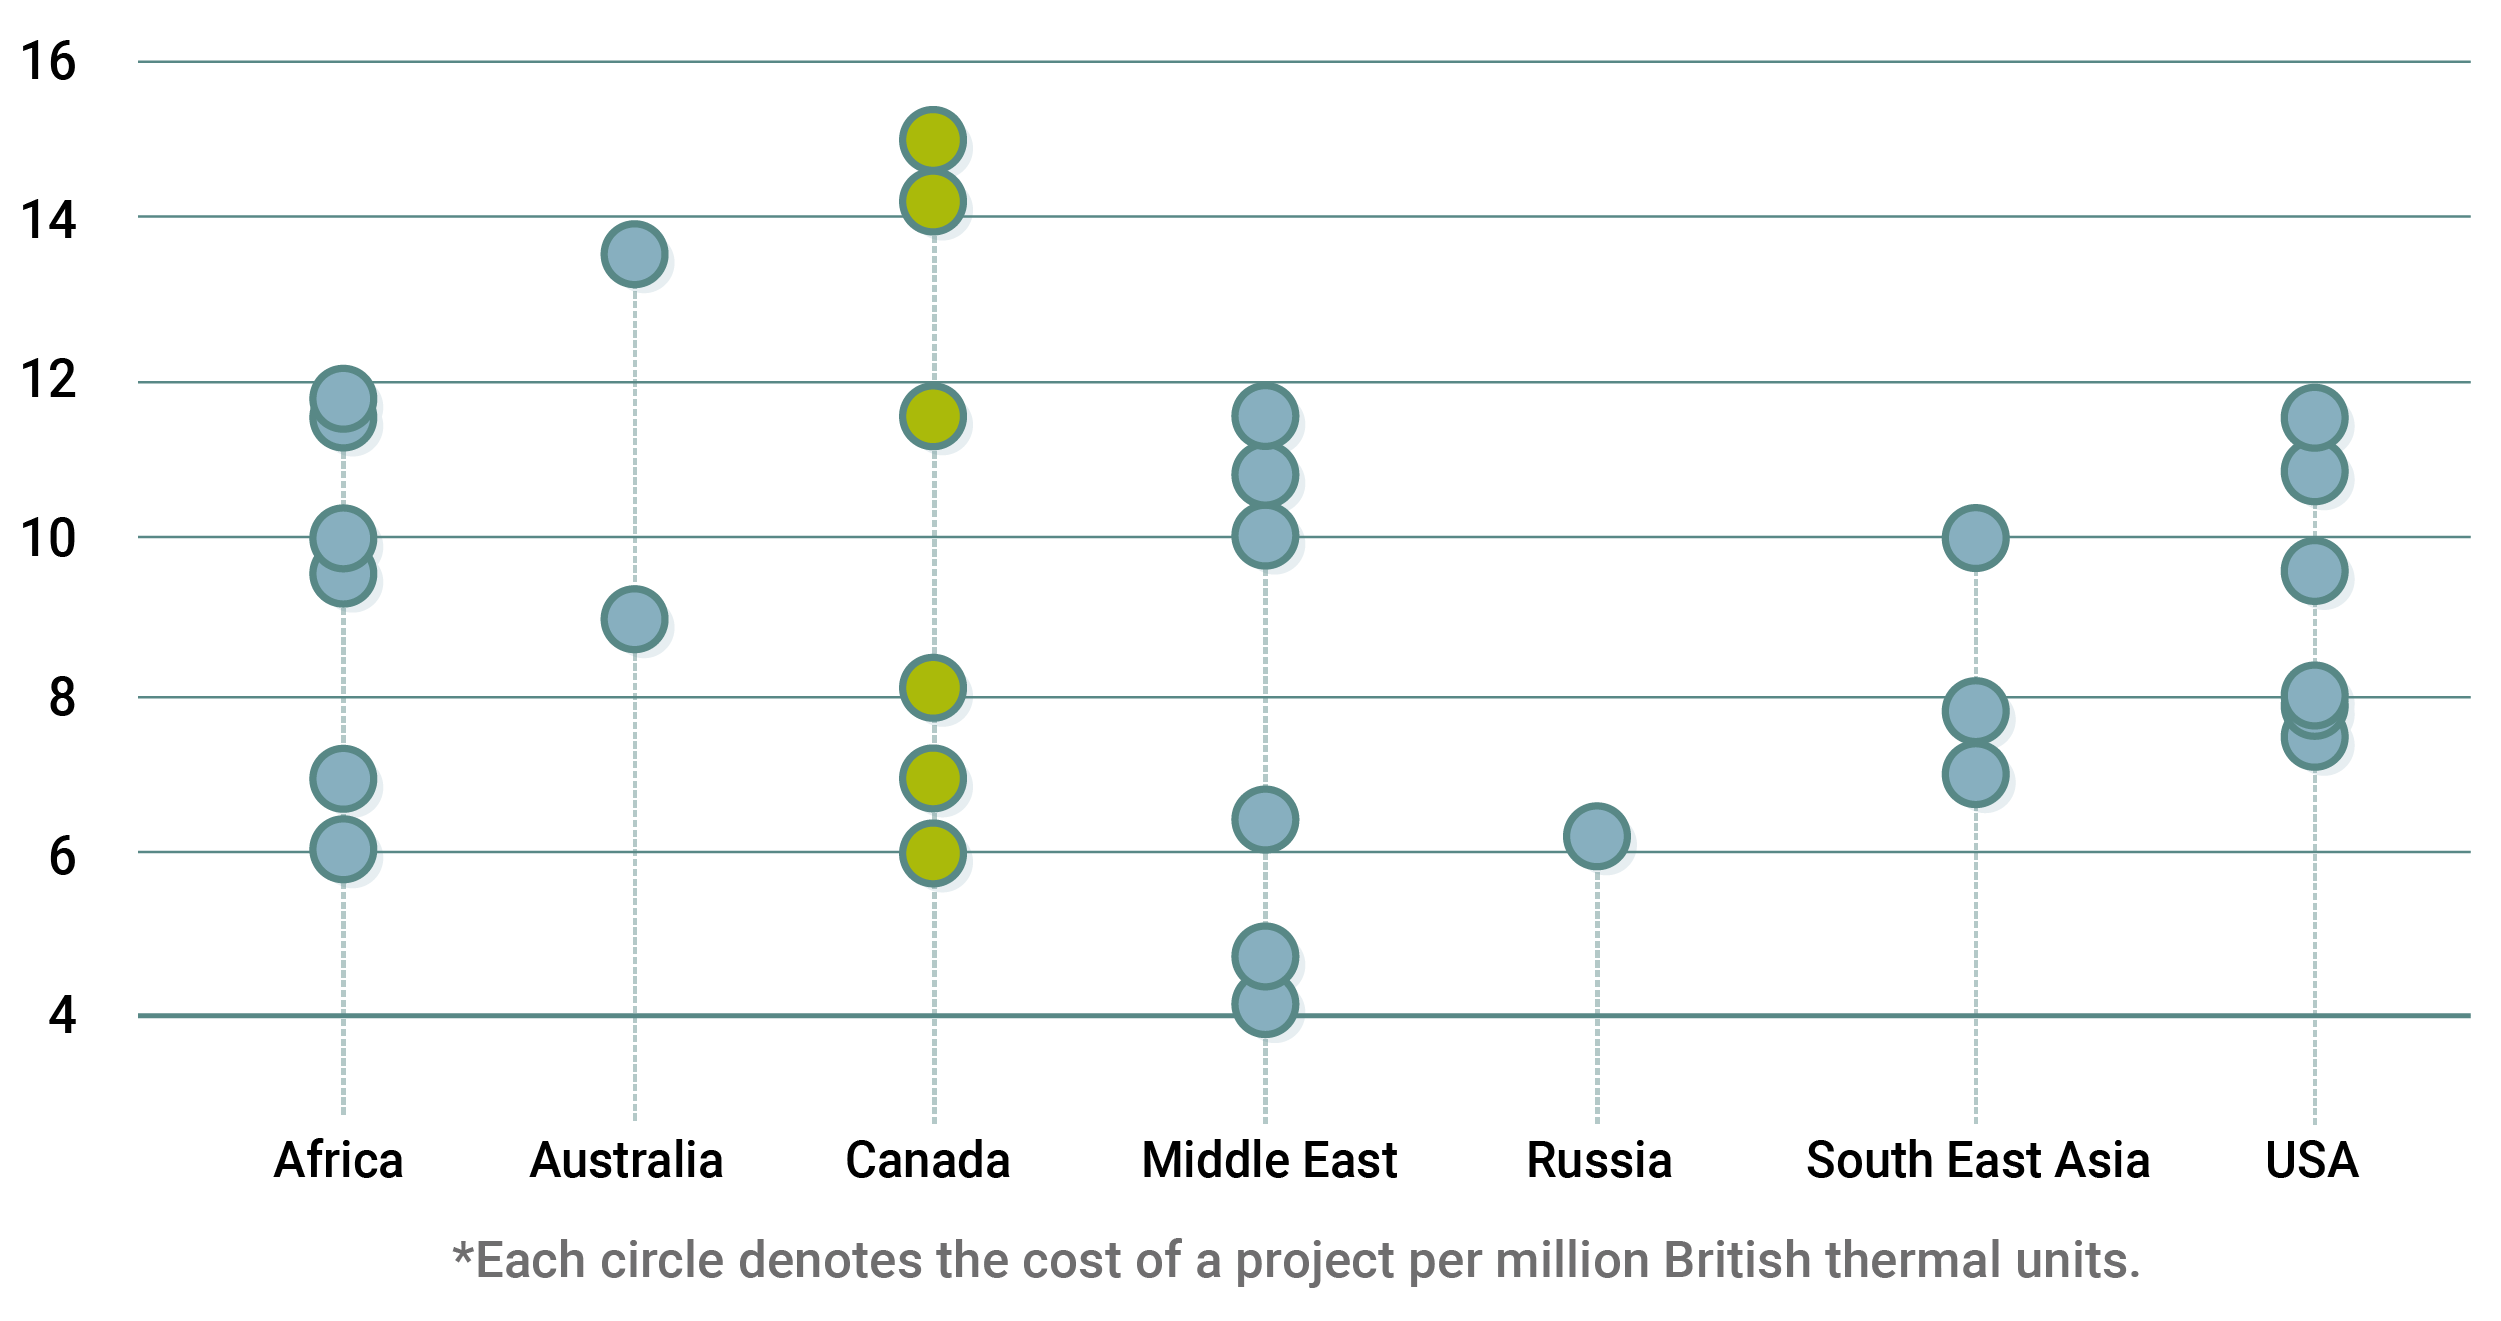
Still, several challenges cloud the cost and profitability picture. Canada’s capital costs for greenfield projects are relatively high and it’s unclear whether foreign consumers are willing to pay added costs for diversified energy supplies. While Canada has existing attributes that can drive a lower emissions profile for its LNG, new oil and gas climate policies requiring rapid industry-led decarbonization could add significantly to costs.
How Canadian LNG projects stack up against rivals
CAD/Mbtu
Here are three ways Canada can support global energy and environmental security.
Scenario 1: The Gulf Coast Gas Exporter
The U.S.’s expeditious LNG buildout serves as an opening for Western Canadian natural gas producers. Canada’s low-cost, plentiful gas resources and investment grade companies are attractive to many U.S. LNG projects competing for stable gas supplies.
Canadian companies have secured supply agreements of 0.3 billion cubic feet per day (bcf/d) with U.S. LNG exporters. Growing these agreements to 1 bcf/d would give Canadian companies exposure to global pricing with limited capital risk.
| New Capacity | Economy | Climate | ||||
|---|---|---|---|---|---|---|
| LNG capacity | Gas production | Investment | Jobs | Royalties | Canadian Emissions | Global Net Emissions |
| – | 1.0 bc f/day | $10B | 6,200 | $4.7B | 3.4 MtCO2e | – |
Climate and economic considerations
- Given the abundance of Western Canadian natural gas, higher U.S.-bound gas exports may not raise production. But if it did, Canadian emissions would increase by 2% relative to current oil and gas sector emissions. That’s directionally opposite to Canada’s stated goal to cut emissions from the sector by 42% by 2030.
- Being a Gulf Coast exporter is not a growth strategy. U.S. LNG could be well supplied with domestic gas reserves over the long-term, new cross-border and interstate pipelines to the Gulf Coast will be difficult to build, and pricing premiums could be captured by other players.
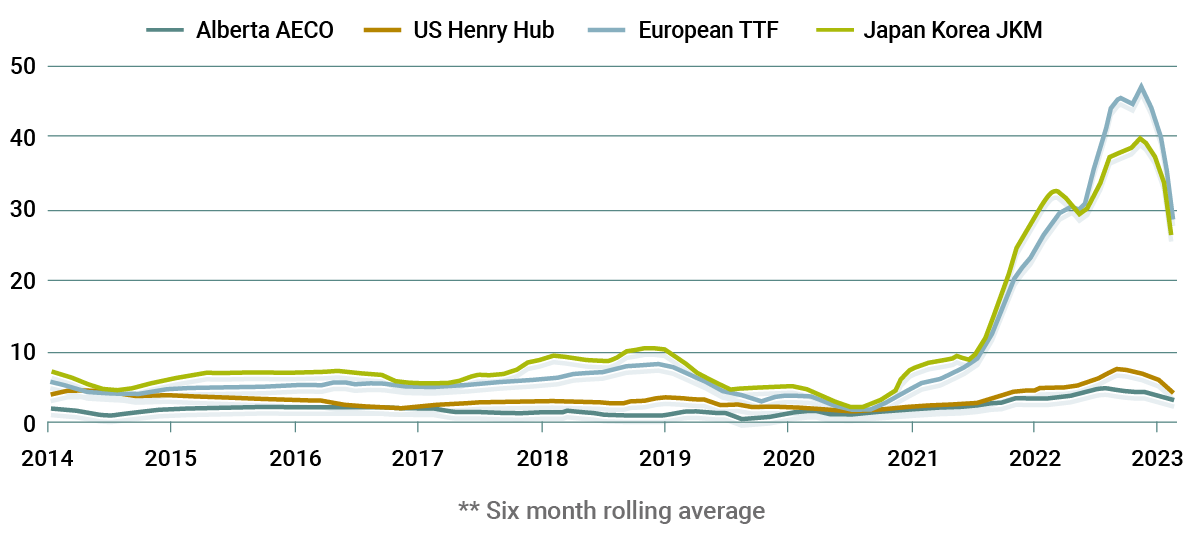
- Without sufficient pipeline capacity to the U.S. or Eastern Canada, or LNG to international markets, the value of Canadian gas resources will continue to be diminished. The result of flooded local markets: Canadian natural gas benchmarks priced at a discount to U.S. and international benchmarks.
Canadian gas priced at a discount to major benchmarks
USD/Mbtu
Scenario 2: The Strategic Exporter
Canada could take a more deliberate role in stabilizing global energy markets, with new LNG capacity of 40 MTPA, or about 7% of current global supply2. Exporting gas could ramp up trade and investment ties with strategic Trans-Pacific economies.
Proposed LNG facilities or those entering the environmental assessment process must demonstrate a credible Net Zero plan by 2030, according to new B.C. rules. Canada’s low emissions and relatively high environmental, social and governance standards would differentiate its gas for markets willing to pay premium prices.
| New LNG Capacity | New Gas Production | Investment | Jobs | Royalties | Canadian Emissions | Global Net Emissions |
|---|---|---|---|---|---|---|
| 40 MTPA | 4.8 bcf/day | $133 B | 95,400 | $22.7B | 16.6 MtCO2e | -105 MtCO2e |
Climate and economic considerations
- Global emissions could fall. Canadian West Coast LNG shipped to China can produce less than half the lifecycle emissions per unit of electricity generated compared to the Chinese average, if it displaces coal fired generation. 3
- The Paris Accord’s Article 6 international centralized emissions trading system—which would verify LNG’s displacement of coal and give Canada credit for global emissions reductions—is years away.
- Major decarbonization of Canadian gas and LNG is technologically feasible and able to abate up to 90% of upstream gas emissions, while full electrification of LNG terminals can cut emissions by 63% compared to electrification for only non-compression systems (as in LNG Canada Phase I). This could add at least $0.7 per Mbtu to producer costs, raising Canadian supply cost.
- Electricity demand for low-emissions LNG terminals and gas supplies would require major new generation and transmission infrastructure. Estimates of terminal electricity demand vary, but could translate into about 10% of BC’s current total electricity generation for every 20 MTPA of LNG—enough to power up to 2 million electric vehicles.4While BC will require new LNG projects entering the environmental assessment process to be Net Zero by 2030, BC Hydro has not yet set out clear provincial electrification plans, leaving a narrow window for new LNG investments.
- Governments could collect substantial royalty and tax revenues from new LNG projects, but with the uncertain long term gas outlook, governments may be asked to pitch in with fiscal incentives to attract new projects, effectively subsidizing allied consumers to ensure energy security.
- Exporting gas to Trans-Pacific economies would strengthen Canada’s Indo-Pacific investment and trade strategy.
| Emissions source (share of emissions) | Technology | Technologically feasible abatement share | Producer Cost (CAD/bcf) |
|---|---|---|---|
| Combustion 63% |
Electrification | 100% | $514,000 |
| Methane Venting and Leaks 17% |
Various – leak detection & repair, blowdown capture, replace pumps, etc. | 68% | $1,900 |
| CO2 Venting 17% |
Carbon capture | 70% | $158,000 |
| Flaring 4% |
Collection & compression of gas into pipelines | 90% | $5,700 |
| Total upstream gas sector emissions = 50 MtCO2e | |||
Source: 2022 National Inventory Report, B.C. Ministry of the Environment, IEA methane tracker, RBC’s $2 Trillion Transition, industry consultation
Scenario 3: The West Coast Hub
By building up to 13% of current global LNG capacity and increasing natural gas production by 60%, Canada could become a global LNG player. But Canada’s high greenfield development and major decarbonization costs would make building clean, competitive LNG supply at scale a tall order.
| New Capacity | Economy | Climate | ||||
|---|---|---|---|---|---|---|
| New LNG Capacity | New gas Production | Investment | Jobs | Royalties | Canadian Emissions | Global Net Emissions |
| 80 MTPA | 9.7 bcf/day | $236 B | 169,000 | $45.5 B | 33.2 MtCO2e | -211 MtCO2e |
Climate and economic considerations
- Gas sector emissions would rise 60%, assuming current technologies. Canada would likely need to provide leeway in domestic sectoral emission targets, given steep decarbonizing costs and difficulty finding sufficient international buyers willing to engage in bilateral emissions trading.
- To keep supply costs competitive and reduce sectoral emissions, new projects could require major fiscal incentives or taxpayer investment in electricity infrastructure. Governments could participate more in the financial upside of new projects, earmarking royalty and tax revenues in this high-risk, high-reward strategy for aggressive domestic decarbonization of non-gas sectors.
- A massive buildout of natural gas could hurt Canada’s reputation as a climate champion. Without consent of Indigenous groups on whose lands most of Montney straddles, upstream gas supplies may have difficulty expanding sufficiently.
- A larger natural gas sector provides a partial hedge against Canada’s oil sector. However, Canada’s economy would be exposed to transition risk if pessimistic natural gas forecasts play out, as more economic activity is exposed to fossil fuels. Stranded gas assets would cease to generate public economic benefits despite historical emissions allowances or taxpayer supports.
| Project | Owners | Location | Status | Capacity (MTPA) |
|---|---|---|---|---|
| LNG Canada Phase 1 | Shell/Petronas/Petrochina/Mitsubishi/Korea Gas | Commercial start mid-decade | 14 | |
| LNG Canada Phase 2 | Shell/Petronas/Petrochina/Mitsubishi/Korea Gas | Kitimat (Haisla Nation territory) | Economic feasibility underway | 14 |
| Cedar LNG | Haisla Nation/Pembina | Environmental Assessment permit received | 3 to 4 | |
| Ksi Lisims LNG Project | Nisga’a Nation, Rockies LNG (Advantage, Birchcliff, Bonavista, NuVista, Paramount Resources & Peyto) and US based Western LNG | Pearse Island, NW coast of BC (Nisga’a Nation land) |
Environmental Assessment Decision in progress | 12 |
| Woodfibre LNG | Pacific Energy Corp. (Singapore)/Enbridge (30%) | Squamish, BC | Approved | 2.1 |
| Tilbury Phase 2 Expansion | Fortis BC | Tilbury Island, BC | Environmental Assessment Decision in progress | 2.5 |
Under construction; all other projects pre-FID (final investment decision)
Source: Project websites, RBC Economics
Ideas to Move Forward
LNG is one of the toughest economic and climate choices for Canada – tremendous upside and downside risks abound on both sides.
The country has historically avoided definitive moves on LNG, which led to a rash of abandoned projects a decade ago. The stakes are only higher now, so Canada cannot dither and be locked into a future decided by chance.
Canada needs to set clear guardrails for its domestic LNG industry, finding the right roles for industry, government, electricity ratepayers, and foreign consumers to best manage its preferred balance of climate and economic risks. Regardless of the outcome Canada aims for, there are key elements missing in the policy framework and industry playbook that will compromise Canada’s ability to move forward at all.
This is where we could start.
- Canada should drive high standards in bilateral emissions trading agreements under the Paris Accord’s Article 6, with the federal government leading the development of robust frameworks through the G7. Canada’s forthcoming sustainable finance taxonomy could include flexibility for long-lived LNG transition assets where tied to verified global emissions reductions.
- The federal government should deliver on promises to fast-track major project approvals and streamline regulatory assessment processes, including working with provinces on assuring a single process per project.
- Industry should seek to expand gas takeaway capacity with existing infrastructure, including investment-grade Canadian operators securing more long-term supply agreements with U.S. LNG developers, investments by midstream companies to optimize pipeline capacity, and gas majors working with pipeline companies to resolve their frequent contract disputes.
- Sponsors of new LNG projects should improve their cost profile by leveraging pipeline or scale efficiencies, leaning on more modular technologies, and proactively managing skilled labour and supply chain constraints.
- Federal and provincial governments should set clearer decarbonization targets for the gas and LNG industry. Their support for sectoral decarbonization should be made clear and scale with Canada’s view of how the sector supports global energy security. The industry needs to deliver on emissions reductions.
- BC Hydro should quickly establish a clear electrification strategy and timetable that helps guide private sector investments in electrification of the sector. Review of the pricing framework for industrial users should appropriately distribute the costs of grid expansion.
- Federal and provincial governments should roll out broad-based supports for Indigenous communities to purchase equity in major projects, including LNG infrastructure, addressing a historic gap in access to capital that has eroded project support and slowed development.
- Industry and government actively communicate Canada’s framework for LNG development internationally, so global investors understand Canada’s relative advantages and openness to investment.
Cynthia Leach, Assistant Chief Economist, Thought Leadership, Royal Bank of Canada
Yadullah Hussain, Managing Editor, RBC Climate Action Institute, Royal Bank of Canada
LNG capacity in mtpa is converted to gas production in bcf/day by assuming a capacity utilization of 80%, multiplying by the LNG-to-gas (bcf) conversion factor of 48.0279, and then dividing by 365. This value is then grossed up to account for fuel use of the LNG terminal, assuming the specifications of LNG Canada Phase I .
Capital investment for LNG liquefaction terminals, upstream gas production and transmission, excludes operating costs. Estimated based on a range of sources, including LNG project proposals. Total (direct+indirect+induced) jobs impact of capital investment (excludes operating costs), using Statistics Canada multipliers for oil and gas construction. Weighted average construction period is 10 years. Current gas sector jobs based on total (direct+indirect+induced) jobs from CAPP. Royalties estimated using 15% rate on revenue, based on one month AECO forward rate.
Canadian emissions are calculated using emissions intensity for upstream BC gas production from the Pembina Institute Shale Gas Tool (historical values, not counting planned emissions reductions) and implied emissions intensity of liquefaction, based on the specifications of LNG Canada Phase I.
Global net emissions reduction based on midpoint of the range of lifecycle emissions savings estimates of Canadian LNG delivered to Asia versus Chinese coal in power generation, based on: Nie et al. 2020, Greenhouse-gas emissions of Canadian liquefied natural gas for use in China: Comparison and synthesis of three independent life cycle assessments, Journal of Cleaner Production
Abatement potential based on IEA methane tracker, RBC’s $2 Trillion Transition, and various discussions with industry and academics.
Electricity requirement for LNG terminal compression and auxiliary power used from: https://silver.rbc.com/en/wp-content/uploads/sites/4/2024/10/Roda-Stuart_Thesis_Final.pdf. BC Hydro system energy balance taken from: https://silver.rbc.com/en/wp-content/uploads/sites/4/2024/10/integrated-resource-plan-2021.pdf
1 Microsoft Word – 19-0156-Letter Report Revised Nov 8 2019 (gov.bc.ca)
2 Operating, under construction, or approved FID LNG liquefaction capacity of 598 MTPA, as of April 2022. https://www.igu.org/resources/world-lng-report-2022/
3 https://silver.rbc.com/en/wp-content/uploads/sites/4/2024/10/Roda-Stuart_Thesis_Final.pdf
4 https://silver.rbc.com/en/wp-content/uploads/sites/4/2024/10/Roda-Stuart_Thesis_Final.pdf. At 80% capacity utilization, this translates into 328 GWh/ MTPA.
This article is intended as general information only and is not to be relied upon as constituting legal, financial or other professional advice. The reader is solely liable for any use of the information contained in this document and Royal Bank of Canada (“RBC”) nor any of its affiliates nor any of their respective directors, officers, employees or agents shall be held responsible for any direct or indirect damages arising from the use of this document by the reader. A professional advisor should be consulted regarding your specific situation. Information presented is believed to be factual and up-to-date but we do not guarantee its accuracy and it should not be regarded as a complete analysis of the subjects discussed. All expressions of opinion reflect the judgment of the authors as of the date of publication and are subject to change. No endorsement of any third parties or their advice, opinions, information, products or services is expressly given or implied by Royal Bank of Canada or any of its affiliates. This document may contain forward-looking statements within the meaning of certain securities laws, which are subject to RBC’s caution regarding forward- looking statements. ESG (including climate) metrics, data and other information contained on this website are or may be based on assumptions, estimates and judgements. For cautionary statements relating to the information on this website, refer to the “Caution regarding forward-looking statements” and the “Important notice regarding this document” sections in our latest climate report or sustainability report, available at: https://www.rbc.com/community-social- impact/reporting-performance/index.html. Except as required by law, none of RBC nor any of its affiliates undertake to update any information in this document.


