Proof Point: U.S. efforts to reduce reliance on foreign goods with the introduction of tariffs on imports, particularly from China, hasn’t lessened U.S. dependence on trade or improved the overall U.S. trade deficit.
- The U.S.-China trade deficit narrowed after U.S. tariffs were implemented in 2018 and 2019, but it has been offset by larger trade deficits with other countries.
- Some countries that started exporting more to the U.S. also saw higher imports and foreign direct investment from China.
- This raises questions about whether the U.S. remains indirectly dependent on Chinese goods through “intermediary” countries.
- The cost of higher tariffs has largely been borne by U.S. consumers and producers as efforts to shore up the U.S. manufacturing sector via import tariffs have been ineffective.
Both U.S. Democratic and Republican administrations have adopted more protectionist policies in recent years to boost the domestic economy and strengthen supply chains for national security reasons. A key strategy by both administrations has been the increased use of tariffs on imported goods.
In 2018 and 2019, amid a flurry of trade policies targeting many countries including Canada, the Trump administration imposed tariffs on Chinese-made goods, citing unfair trade practices and intellectual property violations. These tariffs targeted over US$300 billion in products, ranging from basic goods to more complex items such as semiconductors.
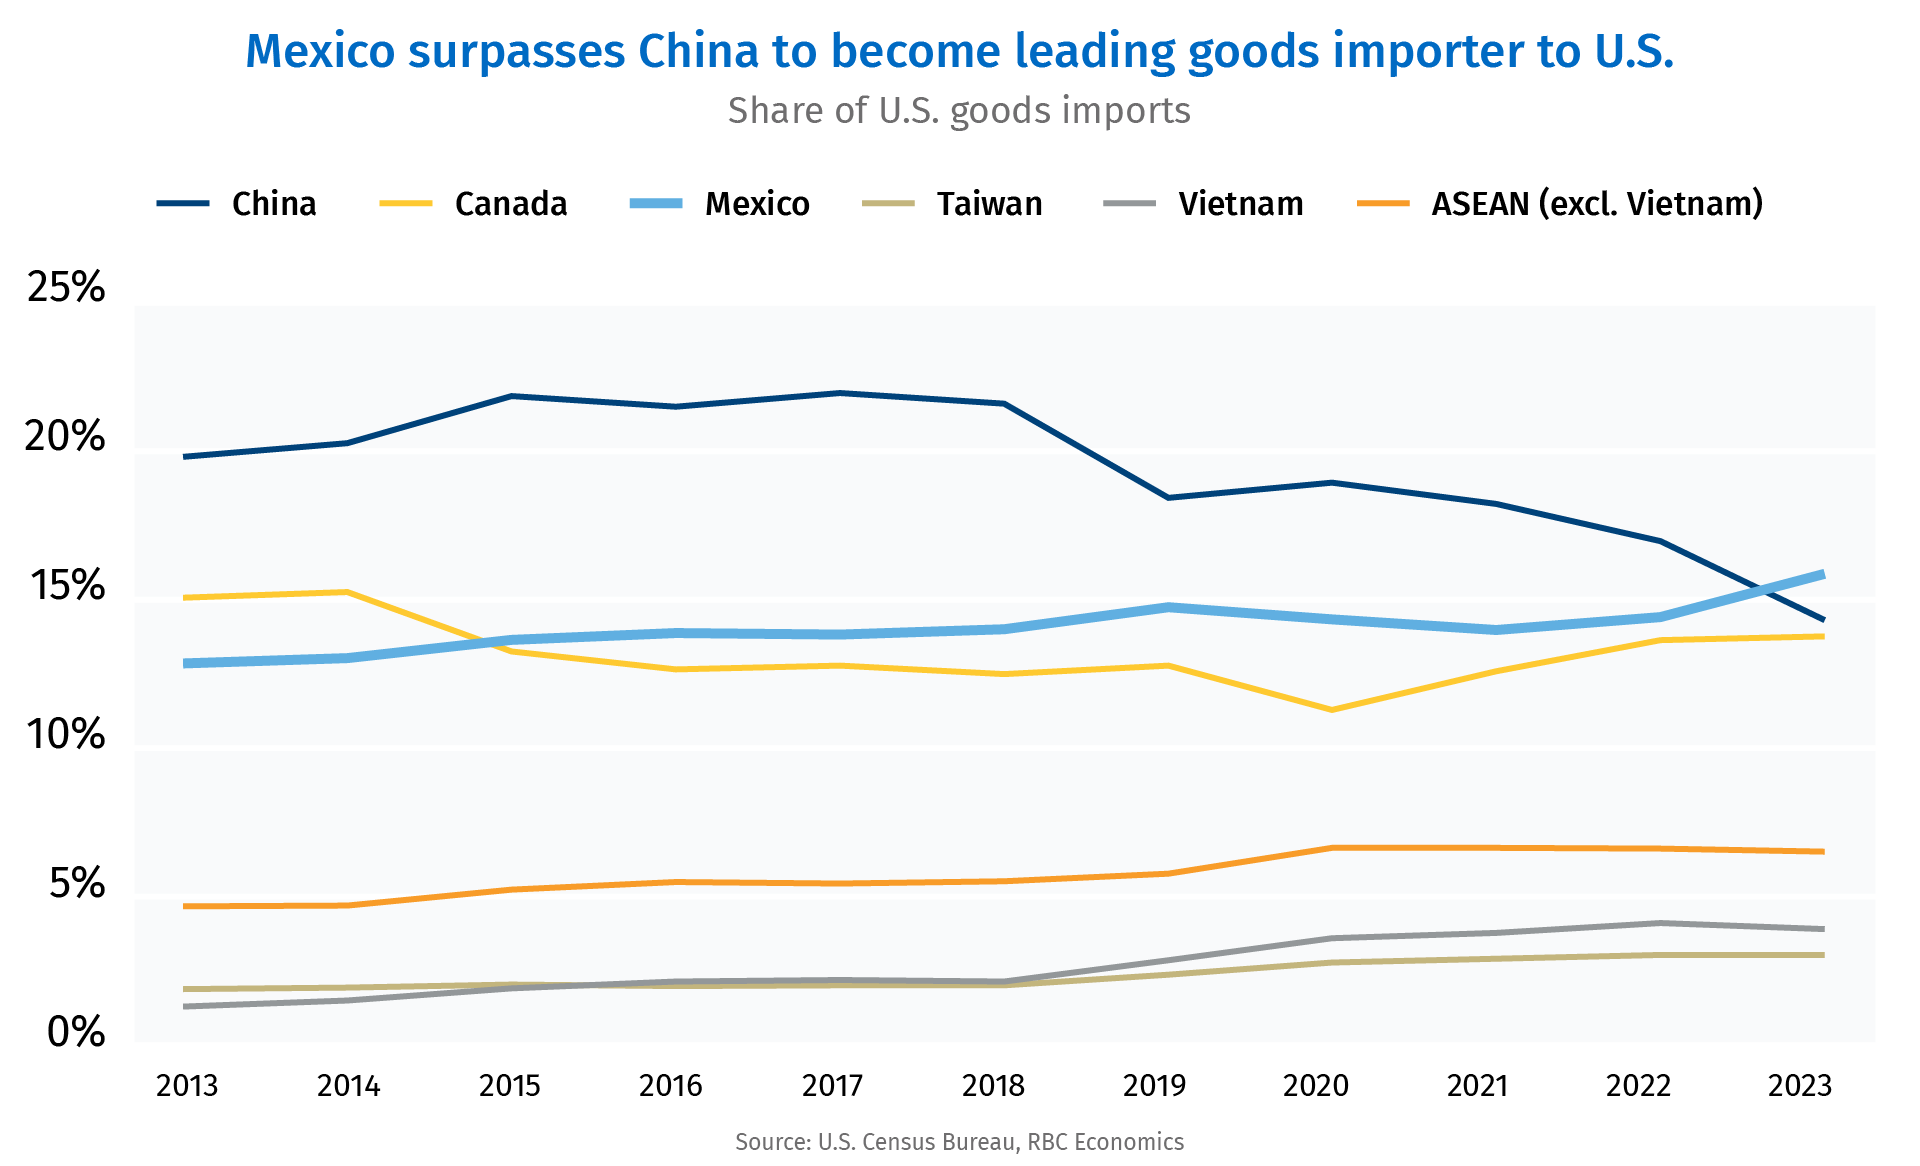
On the surface, tariffs on Chinese goods appear to have successfully reduced U.S. reliance on Chinese imports. After peaking in 2017— just before the tariffs were implemented—China’s market share of total U.S. goods imports fell significantly to 14% in 2023 from more than 21%. The reduction in imports also contributed to an improvement in the U.S.-China trade deficit, which narrowed by US$84 billion between 2017 and 2023.
However, the overall U.S. trade deficit did not improve as a result of the tariffs. The U.S. trade deficit has expanded by US$268 billion since 2017 with its share of gross domestic product remaining relatively stable. The reduction in the trade deficit with China has been completely offset by larger trade deficits with other trading partners.
Mexico surpasses China to become leading importer to U.S.
The U.S. has seen more goods imports from Mexico, Canada, and Asian countries such as Vietnam and Taiwan since 2017.
This shift highlights a reconfiguration of global supply chains as companies largely sought to mitigate the impact of tariffs. Mexico now accounts for the largest share of U.S. goods imports at 15.4%, while some regions have seen their share increase by more than 1% since 2017 including Vietnam and the Association of Southeast Asian Nations (ASEAN) region (excluding Vietnam).

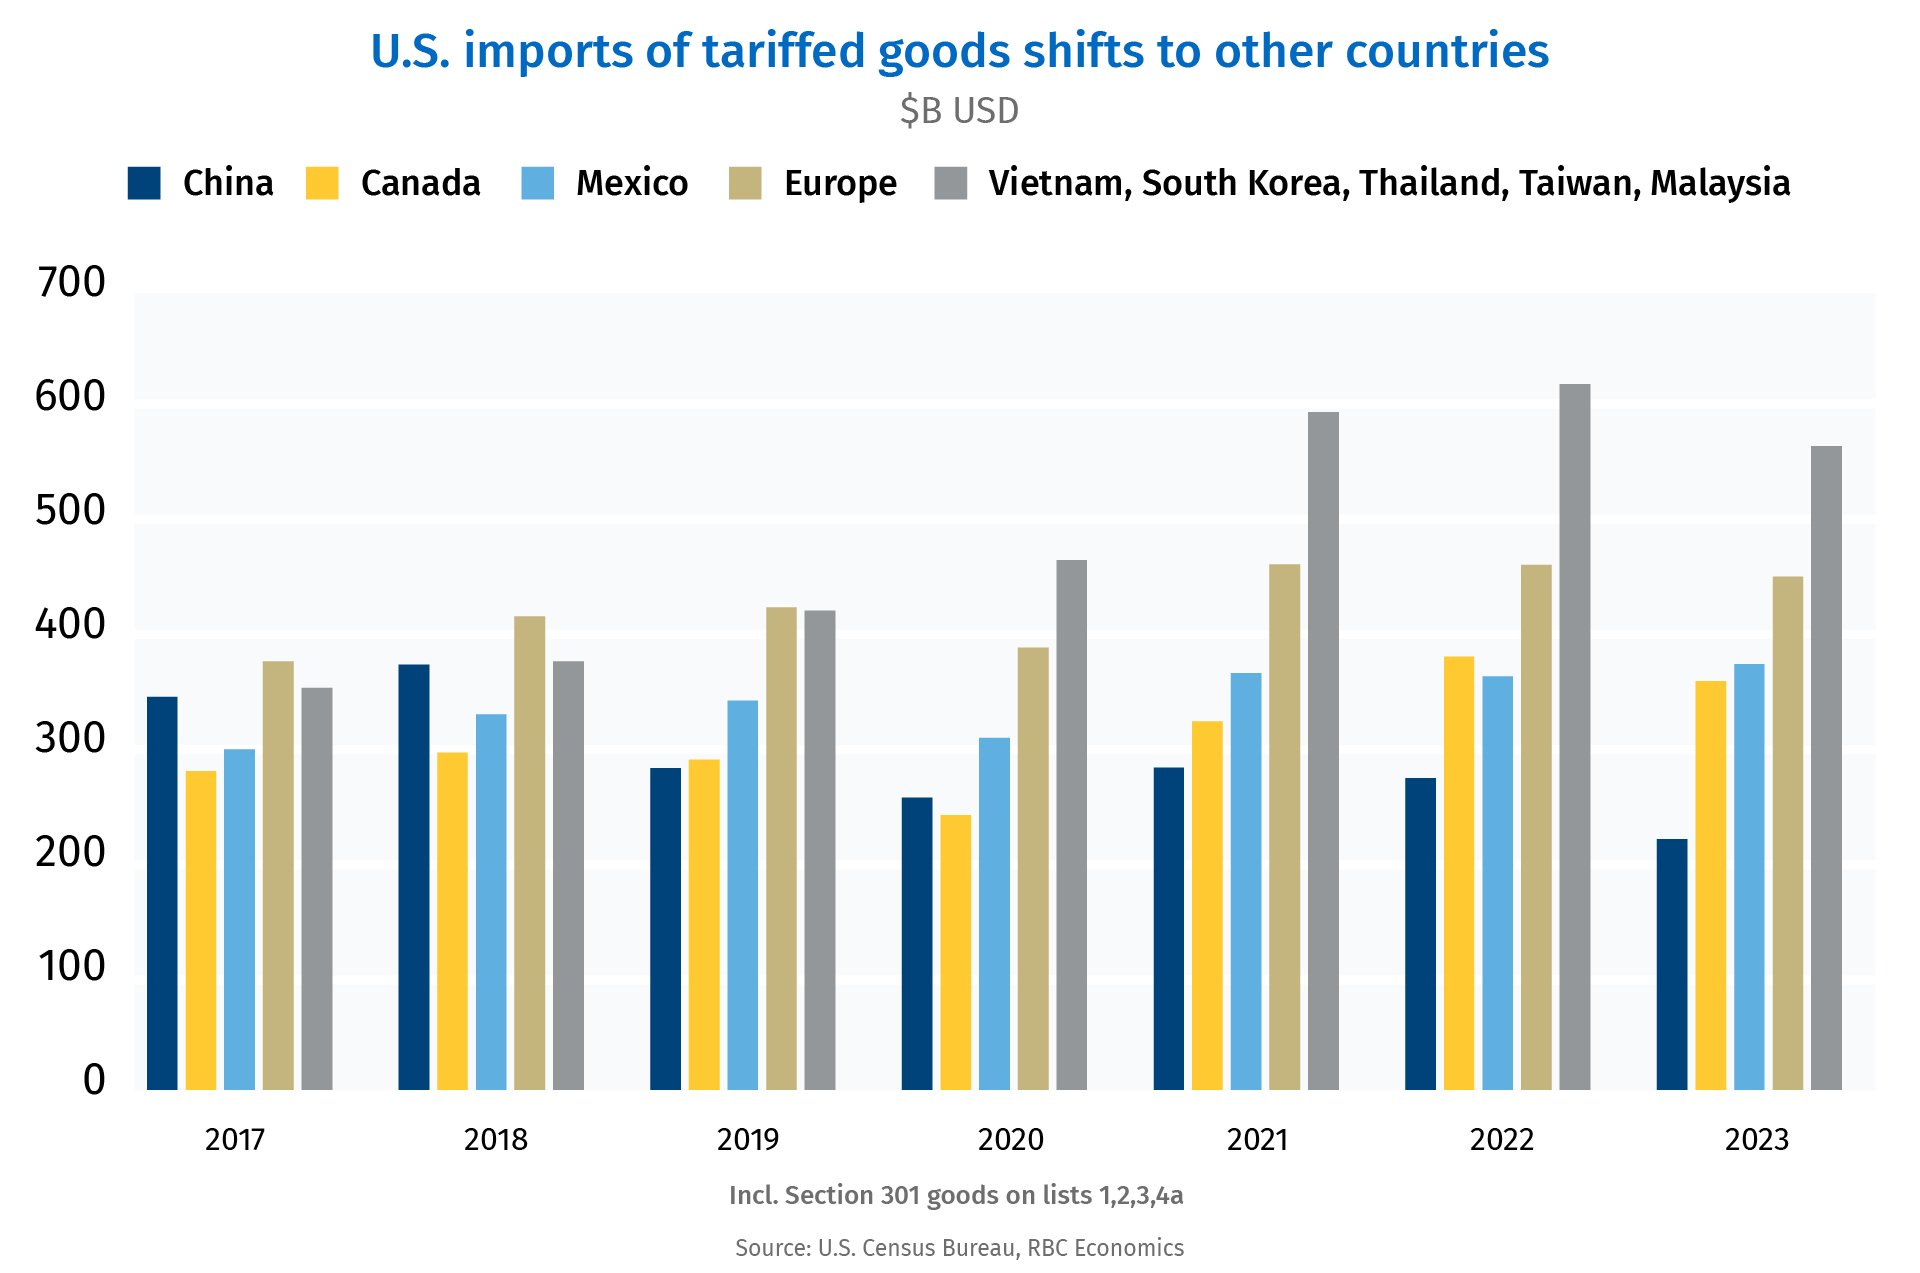
U.S. reliance on goods shifts to other trading partners
Part of the increased trade with other countries can be attributed to the rise in imports of goods affected by the Section 301 tariffs. U.S. imports of tariffed goods from China decreased by US$123 billion since 2017, while imports from other countries expanded by US$413 billion. By 2023, imports of tariffed goods from Vietnam, South Korea, Thailand, Taiwan, and Malaysia accounted for more than twice the total imports from China—marking a significant shift from 2017—when the import levels from these countries were relatively similar.
A similar trend occurred with U.S. imports of advanced technology products (ATPs), some of which are also subject to tariffs. Due to their specialized nature, ATPs are particularly sensitive to geopolitical risks. The U.S. has taken steps to reduce reliance on foreign suppliers, especially from China, for national security reasons. Consequently, U.S. imports of ATPs from China have declined by US$55 billion since 2017, while imports from other trading partners have increased significantly by US$219 billion. Diversification away from China has not necessarily led to a reduction in U.S. dependence on foreign ATPs.

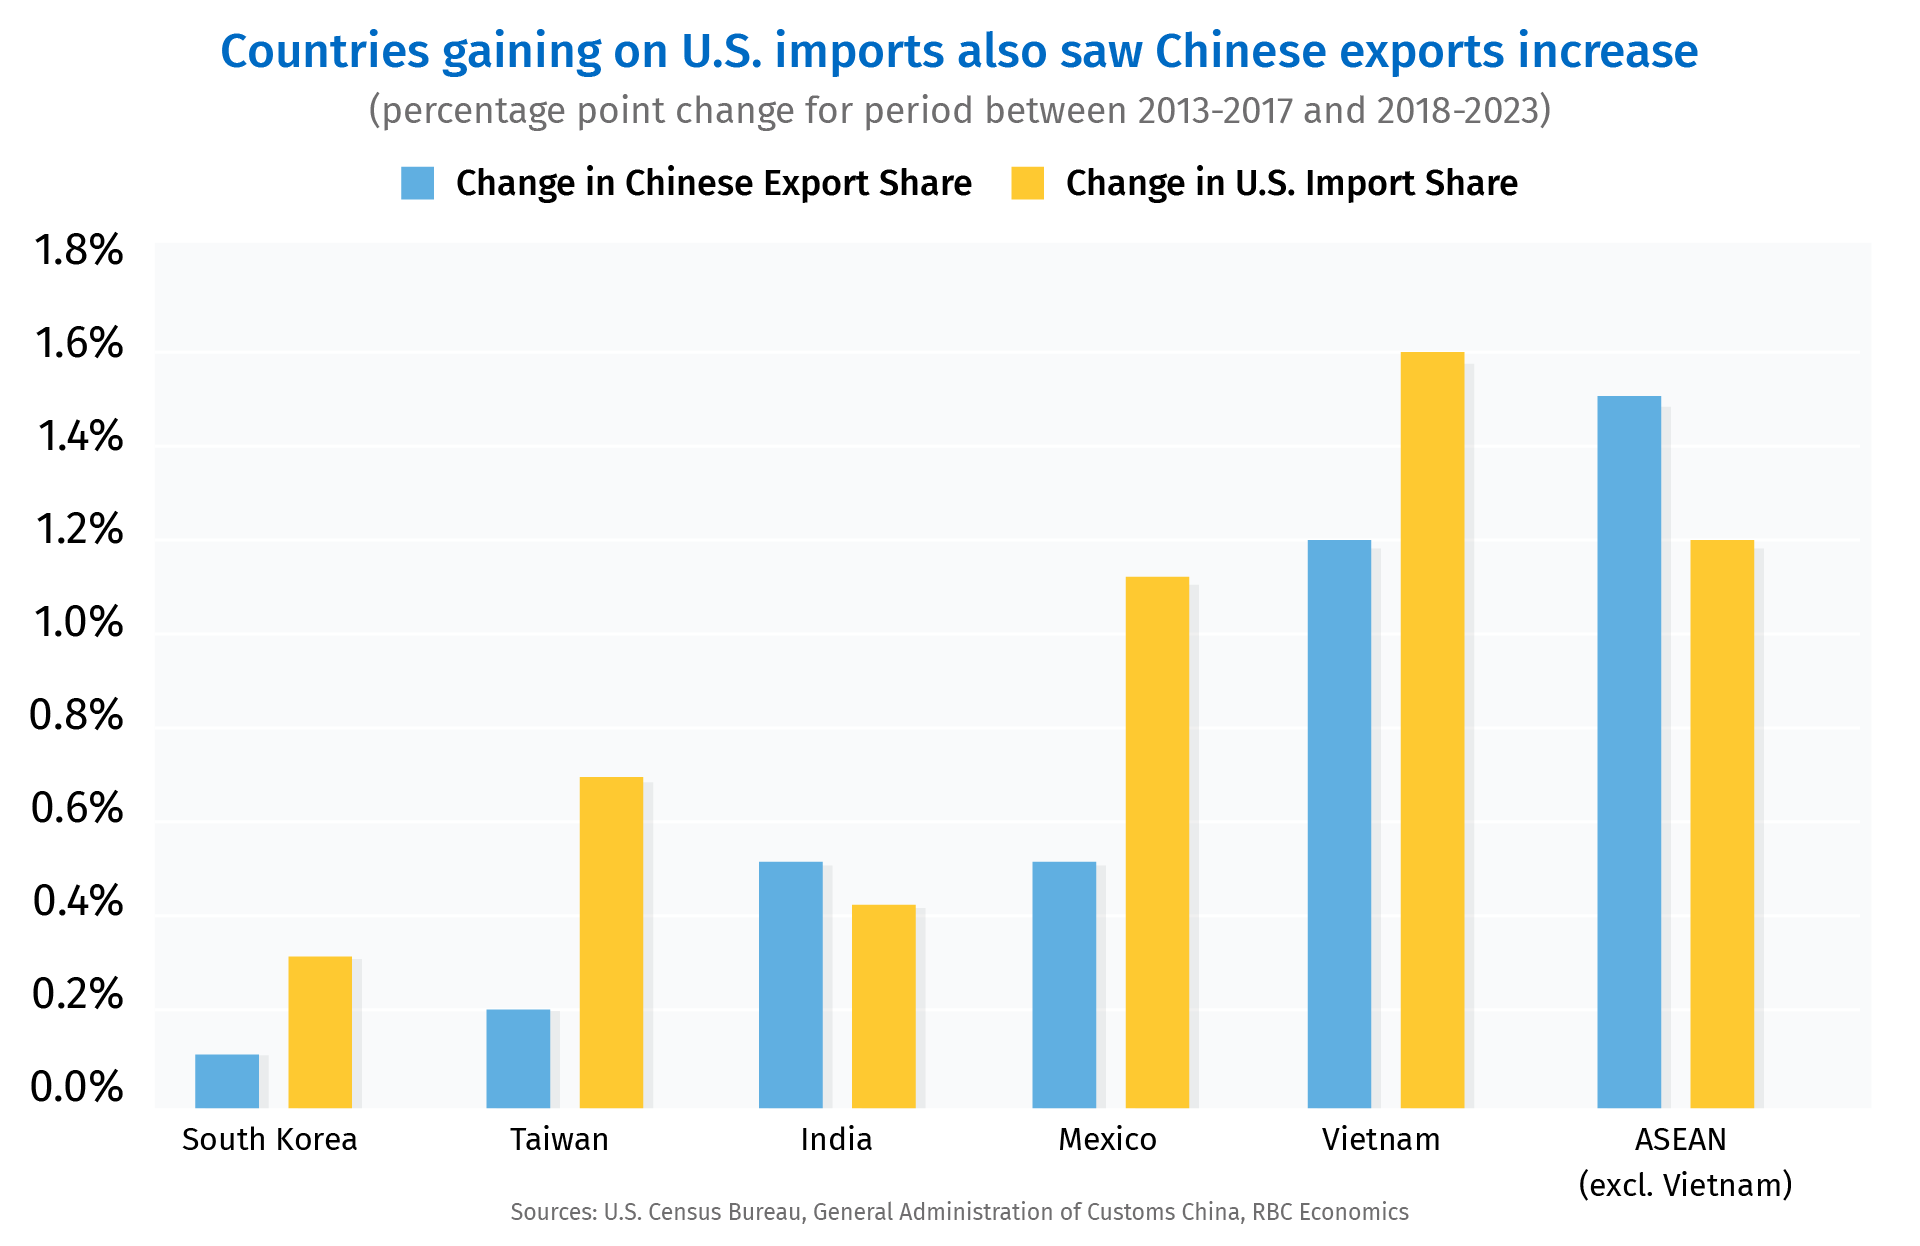
Importers to U.S. also saw increase in Chinese exports
The extent to which the U.S. has truly reduced its reliance on Chinese goods is difficult to establish, because Chinese-made goods may be transiting through other countries to the U.S., or Chinese producers may be relocating their operations.
Chinese goods exports to Mexico and Southeast Asia have risen since 2017. Notably, both Vietnam and Mexico have experienced substantial increases in U.S. imports and the volume of Chinese exports flowing in.

This raises questions about whether the increase in Chinese exports to these “intermediary” countries is an effort to bypass U.S. trade restrictions. There’s also been a rise in Chinese foreign direct investment in Vietnam, Mexico, and other ASEAN countries since 2017. This could be seen as a strategic move to leverage more favorable trade relationships to expand production capabilities in regions that have become key U.S. suppliers.
U.S. consumers and businesses take a hit
In either case, it shows the U.S. may still be indirectly reliant on Chinese goods despite efforts to reduce its dependence on Chinese producers. Imposing tariffs is not desirable from an economic perspective because it distorts market efficiency, raises costs, and can lead to weaker global economic growth. U.S. producers and consumers have largely borne the increased costs from tariffs. It is estimated that export losses for the U.S. agricultural sector hit by retaliatory tariffs totaled more than US$27 billion between 2018 and 2019 with China accounting for about 95% of the losses.
Efforts to shore up U.S. manufacturing also show little progress as production levels remain similar to those from 2017 and the manufacturing sector’s share of total employment continues to decline.
This is particularly important given the increased focus on U.S. trade policies ahead of the November presidential election. The imposition of additional import tariffs is an ineffective tool to narrow the U.S. trade deficit or reduce dependence on foreign-made goods.
Salim Zanzana is a lead economist for RBC. He focuses on emerging macroeconomic issues, ranging from trends in the labour market to shifts in the longer-term structural growth of Canada and other global economies.
This article is intended as general information only and is not to be relied upon as constituting legal, financial or other professional advice. The reader is solely liable for any use of the information contained in this document and Royal Bank of Canada (“RBC”) nor any of its affiliates nor any of their respective directors, officers, employees or agents shall be held responsible for any direct or indirect damages arising from the use of this document by the reader. A professional advisor should be consulted regarding your specific situation. Information presented is believed to be factual and up-to-date but we do not guarantee its accuracy and it should not be regarded as a complete analysis of the subjects discussed. All expressions of opinion reflect the judgment of the authors as of the date of publication and are subject to change. No endorsement of any third parties or their advice, opinions, information, products or services is expressly given or implied by Royal Bank of Canada or any of its affiliates. This document may contain forward-looking statements within the meaning of certain securities laws, which are subject to RBC’s caution regarding forward- looking statements. ESG (including climate) metrics, data and other information contained on this website are or may be based on assumptions, estimates and judgements. For cautionary statements relating to the information on this website, refer to the “Caution regarding forward-looking statements” and the “Important notice regarding this document” sections in our latest climate report or sustainability report, available at: https://www.rbc.com/community-social- impact/reporting-performance/index.html. Except as required by law, none of RBC nor any of its affiliates undertake to update any information in this document.


